By 2026, restaurant business analytics has become an essential tool in helping smart owners who want to protect margins, keep guests happy, and grow business consistently. Rather than guessing you use real restaurant data from your POS, online ordering, reservations, and feedback tools to make every decision sharper.
At the center of restaurant business analytics are some essential KPIs like sales by daypart, item-level profitability, table turn time, average check size, labor cost percentage, and food cost percentage. By tracking these restaurant KPIs in a dashboard helps restaurant owners to see what is working in real time rather than reacting after a few weeks later.
Thoughtful menu engineering is not an important strategy for improving restaurant profits and performance. By combining POS data with recipe and costing information, you can quickly identify your high profit, high volume as well as the low-performing items that waste time, space, and margin. In 2026, the best restaurant operators constantly test prices, portions, and placement on the menu, using analytics to validate every change.
Customer behavior analytics are also equally important. Because when you connect loyalty data, visit frequency, and order history then you can see which guests are at risk of churning while which offers drive them back, and which channels – email, SMS, social works best.
Ultimately, modern restaurant analytics tools extract all this data into simple, visual dashboards. Because of restaurant analytics tools instead of exporting spreadsheets, you see trends like rising costs, slower service times, or fewer repeat visits. That means faster decisions, less waste, and more revenue.
As a restaurant owner, if you want to stay competitive in 2026 and beyond, building a disciplined restaurant data strategy empowered by clear KPIs, integrated POS data, and easy-to-read analytics which is no longer optional. It’s how you turn every shift, every menu, and every guest interaction into a source of growth.
Also Read: How Restaurant Analytics and Reporting Drive Better Business Decisions
What Is Restaurant Business Analytics?
Restaurant business analytics is the process of collecting, organizing, and analyzing data from across your operation so you can make smarter, faster, and more profitable decisions. Using these analytics tools helps restaurant owners to not just depend on gut feeling, but use real numbers to guide everything like menu pricing, staffing, marketing, and business expansion plans.
To work properly, restaurant business analytics usually extracts from multiple systems and combines them into one view:
1. POS and online ordering systems
These are your main sources of accurate, detailed sales information. Such systems show what sells, when it sells, at what price, and through which channels whether through dine-in, takeaway, online, kiosk, and more. You can analyze average check size, top-selling items, daypart trends, and discount impact.
Also Read: POS Reports Vs Real-Time Analytics
2. Delivery platforms
Third-party delivery analytics show you how much profit each platform truly generates after fees, commissions, and promotions. It helps you to know about the dishes that work best for delivery, which areas respond well, and which costs are reducing your profit margins.
Also Read: How AI is Boosting Restaurant Revenue and Profits
3. Reservations and waitlist tools
These tools uncover guest flow patterns like peak hours, table turns, no-show rates, and average party sizes. These insights help you to optimize seating, reduce wait times, and schedule staff with much greater accuracy.
Also Read: Explore Two Everyday Uses Cases of Operators
4. Inventory and recipe management
This data allows you to monitor theoretical versus actual usage, plate costs, waste, and variance. When it is integrated to your POS, you can calculate actual food cost and profitability per item and identify issues like over-portioning or spoilage.
Also Read: AI for Retail Inventory Management
5. Labor and scheduling software
By connecting sales to labor hours, you can monitor labor cost as a share of revenue, identify overstaffed or understaffed shifts, and create smarter schedules that control expenses without sacrificing service quality.
Also Read: How Data Analytics Improve the Measurement of Employee performance
6. Marketing & social platforms
With data from Meta, Google, email tools, and social channels helps you see which campaigns actually lead to bookings, orders, and revenue so you stop wasting money on underperforming advertisements.
Also Read: Social Media Marketing for Restaurants
7. Accounting / P&L
Ultimately all of your data streams into your profit and loss statement, where restaurant business analytics connects day-to-day operations, costs, and revenues to real financial outcomes so that you can clearly see whether each decision helps or obstructs your overall profitability and long-term growth.
Also Read: Restaurant Profit Margin Tools to Boost Profits
Restaurant Analytics in Four Layers
1. Descriptive Analytics – What happened?
This is your starting point. Descriptive analytics summarizes what has already occurred in your restaurant. For instance, yesterday’s sales, total covers, average check size, food cost%, labor cost%, and discount usage. It helps you quickly answer questions like how busy you were, how much you sold, and whether you actually hit your key targets. Consider it as the scoreboard for your operations.
Also Read: Predictive Analytics in Restaurants
2. Diagnostic Analytics – Why did it happen?
Once you know what happened, diagnostic analytics explains why. For instance, a dip in Monday sales might be due to heavy rain, reduced ad spend, and fewer reservations. You connect causes with outcomes like weather, marketing, staffing, pricing, or menu changes. This layer stops you from guessing and prevents wrong assumptions.
Also Read: How Restaurants Can Regain Confidence in Their Numbers
3. Predictive Analytics – What’s likely to happen next?
Predictive analytics predicts the future by using historical data and patterns. It helps you to predict sales and covers by daypart, estimate demand for specific dishes, or predict the impact of a promotion. This lets you plan inventory, staffing, and promotions in advance instead of reacting at the last minute.
Also Read: From Dashboards to Decisions
4. Prescriptive Analytics – What should we do about it?
Prescriptive analytics is where your data stops just describing reality and actually recommends the next best action. Prescriptive analytics recommends ideal labor levels, reorder quantities,menu price changes, and which campaigns to run. It turns insights into clear, practical actions which you can take right away.
Also Read: Optimizing a Restaurant Menu with AI-Powered Data Analytics
In 2026
In 2026, analytics is no longer just some static reports rather it’s the engine which drives your entire restaurant. It drives smarter menu options by showing what truly sells, guides staffing, supports data-backed pricing decisions, improves your marketing targeting, and improves the overall guest experience. Rather than reacting late, you use real-time insights to operate efficient, profitable, and customer-focused restaurants every single day.
Why Analytics Matters Even More in 2026
A few big shifts are driving serious investment in restaurant tech and analytics.
- The global restaurant tech market hit about $59.3 billion in 2024 and is projected to reach over $314 billion by 2033 with a 16% increase in annual growth rate.
- Restaurants using analytics have reported an increase in revenue by 5-10%, and almost 15% lower operating costs, and up to 20% better EBITDA when analytics is applied properly.
Also Read: Real-Time Analytics Why Does Your Business Needs it
Food and labor costs stay unpredictable
- Prices for ingredients and wages keep constantly changing, sometimes changing from one month to the next.
- This makes it harder to maintain steady margins unless you are constantly monitoring the numbers and making adjustments.
Also Read: How to Calculate Food Cost Percentage
Guest expectations are rising fast
- Guests today expect fast service, personalized offers, and smooth digital ordering every time they interact with your restaurant.
- If your service feels slow or your ordering experience is confusing, guests can abandon your restaurant and switch to another restaurant in just a few taps.
The Core Metrics Every Restaurant Should Track
There are endless restaurant key performance indicators but you don’t need to track every possible KPI. A smart restaurant business analytics strategy begins with a focused metrics stack across four key areas:
- Sales & Revenue
- Costs & profitability
- Guests & marketing
- Operations & labor
Together, these metrics show you where revenue is generated, where profits are slipping away, how your guests actually behave, and how smoothly your restaurant is operating day to day.
1. Sales & Revenue Metrics
These metrics show how much money you are making and which parts of the business it is coming from.
Total sales (daily / weekly / monthly / by location)
- It shows the overall revenue performance of your business.
- Tracking by day, week, and month reveal current restaurant trends, seasonality, and event impact.
- Comparing locations highlights top performers and those needing attention.
Average check size (per cover, per order)
- Measures how much each guest or ticket is worth on average.
- Helps you evaluate upselling, cross-selling, and menu bundling strategies.
- It is essential to track during Sunday brunch, weekend peak shifts, and high-traffic special events.
Sales by channel – dine-in, takeaway, delivery, online ordering
- Breaks down revenue by how guests buy from you.
- Shows whether delivery is incremental or cannibalizing dine-in.
- Helps you negotiate better terms with aggregators and adjust channel strategy.
Sales by daypart – breakfast, lunch, dinner, late-night
- It clearly shows which dayparts are performing strongly and which dayparts are underperforming.
- Informs decisions about opening hours, daypart-specific menus, and promotions.
Sales per labor hour – sales ÷ total labor hours
- One of the most important productivity metrics.
- Shows how much revenue you generate for every hour of labor paid.
- Helps you schedule efficiently and prevent overstaffing during slower shifts.
Menu item sales & contribution
- Tracks how often each item sells and how much profit it contributes.
It separates the genuine top-selling dishes from the ones that barely get ordered. - Forms the foundation for menu engineering and pricing decisions.
Also Read: Retail Pricing Strategy
2. Cost & Profitability Metrics
You can’t improve margins if you don’t measure, and that’s why cost and profitability KPIs are the core of restaurant business analytics. By tracking food cost%, labor cost%, prime cost, inventory turnover, and waste or variance, you see exactly where profit is made, where there is loss.
Food cost percentage (FCP)
- Calculated as (Food Cost/Food Sales) × 100
- Measures how efficiently you manage purchasing, portions, and food waste.
- Benchmarks differ by restaurant style, but keeping your metrics within the right target range is essential.
Labor cost percentage
- Calculated as Total Labor Cost/Net Sales
- Shows how much of each sales rupee or dollar goes to staffing.
- It helps you to optimize staff schedules, prevents costly overtime, and improves overall team efficiency.
Prime cost
- Calculated as Food Cost % + Labor Cost %
- Considered the most important profitability metric for many operators.
- A common target is around 60% of sales, depending on concept and region.
Inventory turnover
- Calculated as Cost of Goods Sold (COGS)/ Average Inventory
- Indicates how quickly you are using up stock.
- Low turnover often means over-ordering, slow-moving SKUs, or menu imbalance.
Waste & variance
- Measured through inventory and recipe systems as a percentage of food purchased.
- Shows how much product is lost to wastage, over-portioning, mistakes, or theft.
Also Read: AI Solution for Reducing Restaurant Waste
3. Guest & Marketing Metrics
Because every dollar of restaurant revenue comes from your guests, restaurant analytics must also track how they behave,what they respond to, and which marketing messages, channels, and offers are effective at driving visits and expenses.
Core guest KPIs
- Customer retention rate – percentage of guests who return within a defined period.
- Visit frequency – average visits per guest per month or quarter.
- Average spend by segment – new vs returning, loyalty vs non-loyalty.
- Review scores & sentiment – ratings and text sentiment on Google, Zomato, Yelp, etc.
- Net Promoter Score (NPS) – how likely guests are to recommend you.
Marketing KPIs
- Customer acquisition cost(CAC) – calculated as marketing spend/new guests acquired.
- Return on ad spend(ROAS) – calculated as revenue attributed/campaign spend
- Campaign performance – conversions from SMS, email, Instagram, Google Ads, etc.
Also Read: How AI is Revolutionizing Customer Experience
4. Operations & Labor Metrics
These metrics reveal how smoothly your floor and kitchen run. It reveals table turns, ticket times, walkways, and sales per labor hour. These data helps you to streamline staffing, service flow, and overall restaurant performance.
Table turnover rate
- Calculated as Covers/Number of Seats in a time period.
- A strong, healthy turnover rate means you can serve more guests without sacrificing a relaxed, enjoyable experience for each customer.
- Informs decisions about layout, seating policy, and reservation rules.
Average ticket time
- Measures time from order placed to food on the table.
- Critical for guest satisfaction and speed of service.
- It helps you to identify slowdowns in the kitchen or in how orders move through service.
Wait time & abandonment
- It measures how long guests are willing to wait for a table before they sit down or decide to leave.
- It helps you see whether long customer waits are quietly costing your revenue.
- It supports decisions about waitlist systems, pre-ordering, or adding seating.
Sales per labor hour (repeated here for operations)
- It connects productivity to actual shifts and roles.
- It is useful for comparing performance between days, teams, or locations.
Staff productivity
- It measures how effectively your team turns time on the floor or in the kitchen into revenue and completed orders.
- Example metrics: Sales per server, Orders per cook-hour, Tickets or drinks per bartender.
- Highlights top performers you can learn from or reward.
- Reveals who needs extra training, coaching, or better tools and support to succeed.
Also Read: How AI is Expanding Restaurant Customer Base
Building Your Restaurant Analytics Stack
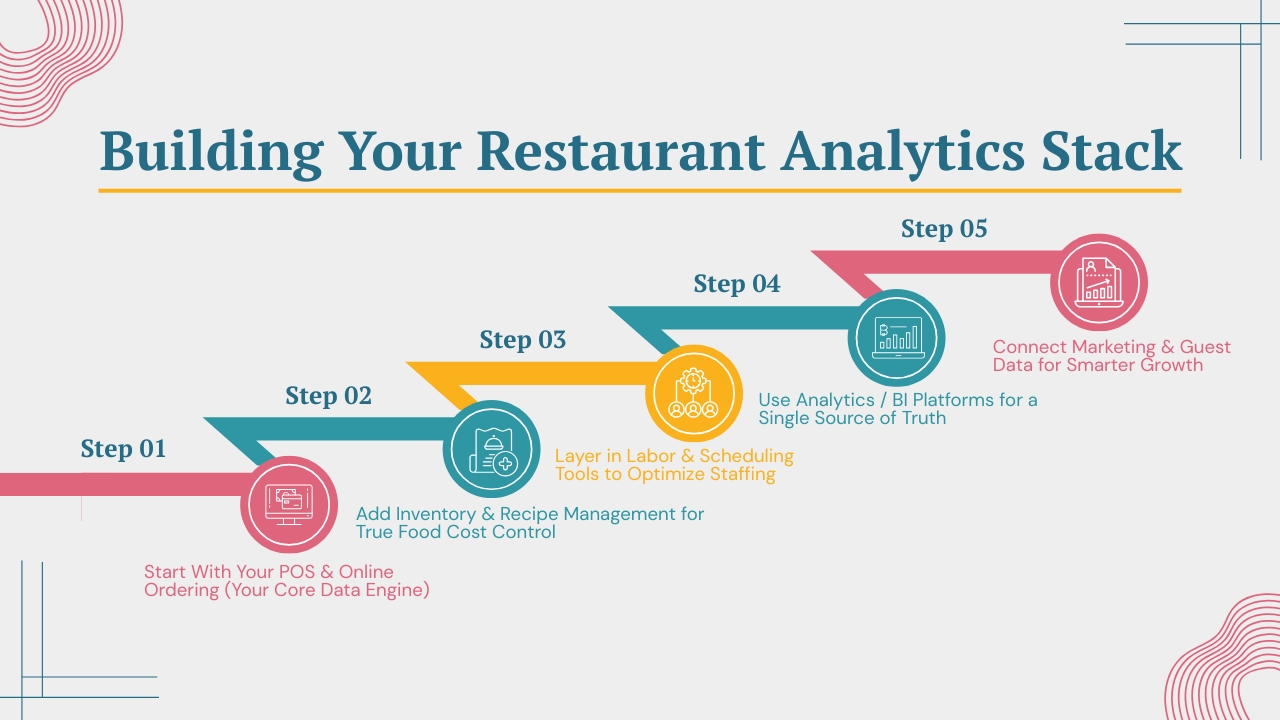
You don’t need a massive IT budget to get started in 2026, but you do need tools that communicate to each other.
1. Start With Your POS & Online Ordering (Your Core Data Engine)
Your POS is the foundation of your restaurant analytics stack. Modern POS and online ordering systems should monitor sales by item, category, time, server, and channel, and integrate smoothly with delivery partners. While upgrading or evaluating POS systems, ensure that the systems exports clean data, offers built-in dashboards for sales, menu performance, and staff, and connects easily with your inventory, labor, and marketing tools.
Also Read: Optimizing Table-Turnover Using Analytics
2. Add Inventory & Recipe Management for True Food Cost Control
Inventory and recipe management tools help you keep a real-time pulse on stock levels and food cost per recipe and per plate. They also highlight variance between theoretical and actual usage. This layer is crucial for controlling food cost and waste which is two of your biggest cost levers so you can tighten portions, reduce spoilage, and price dishes with confidence.
Also Read: AI for Restaurant Inventory
3. Layer in Labor & Scheduling Tools to Optimize Staffing
Scheduling tools allow you to predict labor needs on the basis of historical sales patterns, monitor labor cost% in real time, and monitor productivity and compliance. In 2026, many of these platforms use AI to auto-suggest schedules, identify overstaffing or understaffing, and anticipate spikes due to holidays, local events, or campaigns so that you are staffed “just right” instead of guessing.
Also Read: Boosting Brand Loyalty With Customer Sentiment Analysis
4. Use Analytics / BI Platforms for a Single Source of Truth
Dedicated restaurant analytics or BI platforms operate on top of your POS, inventory, labor, and marketing systems, aggregating everything into one place. It provides central dashboards for multi-location operators, KPI monitoring with alerts, forecasting for sales, labor, and purchasing, including custom reports and drill-downs. Thereby you get to move from scattered reports to a true command center.
Also Read: Business Intelligence Dashboard for Data Collection
5. Connect Marketing & Guest Data for Smarter Growth
Guest data platforms and CRMs unify reservations, online ordering profiles, email or SMS or loyalty activity, and feedback or reviews. In 2026, expect AI-powered campaign recommendations, similar modeling to find ideal customers, and real-time triggers such as an offer when a frequent guest has not visited in 30 days to improve visits and average spend.
Big Restaurant Analytics Trends Shaping 2026
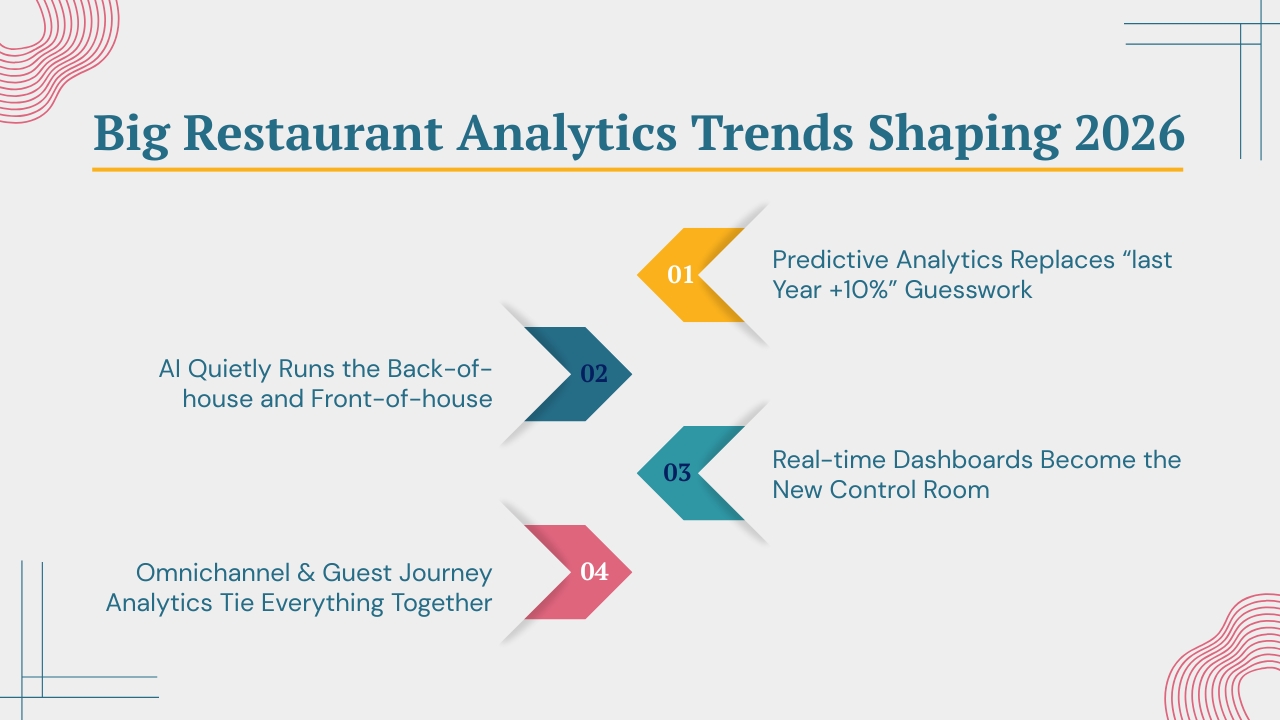
1. Predictive analytics replaces “last year +10%” guesswork
Modern forecasting tools such as Livelytics pull in historical sales, weather, local events, holidays, delivery trends, and even cuisine shifts like plant-based, premium snacking and more. Rather than reacting when there are busy hours has already hit, you see likely demand by daypart, channel, and location. Livelytics forecasting views help you tighten sales and labor plans, generate preparation lists, and keep less cash trapped in the wrong inventory at the wrong time.
Also Read: How Data Analytics Help Restaurants Grow
2. AI quietly runs the back-of-house and front-of-house
AI is no longer a side project, rather it is integrated into Livelytics’ core engine. It highlights odd inventory usage, warns potential waste or shrink, recommends reorder quantities, and surfaces dishes with the strongest contribution margin. On the front-of-house side, Livelytics connects to guest and campaign data so you can build smarter segments and offers, without needing a data science team.
Also Read: AI Unlocks Business Insights the Drive Required Results
3. Real-time dashboards become the new control room
Static weekly or monthly PDFs can’t keep up with live service. Livelytics solves this issue as it gives operators real-time dashboards showing sales, food cost, labor cost, channel mix, and key KPIs in one place. As it is cloud-based and mobile-friendly it acts like a “command center in your pocket.” You can adjust staffing mid-shift, change preparation based on live demand, change promos for slow locations, and catch margin shortages while they are happening and not after that period is over.
Also Read: Machine Learning for Business Analytics
4. Omnichannel & guest journey analytics tie everything together
By 2026, your restaurant spans across dining rooms, website, delivery marketplaces, and social or messaging. Livelytics connects these touchpoints into one guest journey where guests discover you, how they placed first and repeat orders, and which channels create your highest-value regulars. With unified journey and revenue analytics, you are confident enough to decide whether to improve your own ordering UX, or consider a profitable marketplace, or increase local search and social based on real Livelytics data and not assumptions.
Step-by-Step Roadmap to Becoming Data-Driven in 2026
1. Define 2–3 business goals, not 20
Start by deciding what really matters this year such as higher profit, stronger guest loyalty, or smoother operations. For instance, you might aim to improve net profit margin by 3 points, raise average check by $1, and reduce food waste by 20%, or increase repeat visits by 15%. When you feed these goals into Livelytics, every chart and KPI can be aligned to those “North Star” outcomes instead of disconnected metrics.
2. Audit every system that touches data
Make a simple list of your tools like POS, reservation or waitlist tools, inventory software, scheduling/payroll, online ordering and delivery platforms, and loyalty/CRM or email tools. Mark the systems that keep data isolated in silos and which ones already support exports or integration. Livelytics can extract from these data sources to create a single, unified analytics layer rather than forcing you to log into five different dashboards.
3. Pick 8–10 KPIs that directly support your goals
For profit goals, focus on total sales, food cost%, labor cost%, prime cost, inventory turnover, waste%, average check, and sales per labor hour. For guest growth, focus on metrics like new versus returning guests, retention rate, visit frequency, average check by segment, NPS or review scores, and the ROAS of your campaigns. Livelytics organizes these KPIs into clear, consistent dashboards so your team gets focused insights rather than feeling overwhelmed by data.
4. Set up dashboards that match your rhythm
Start with basic POS reports, and then connect POS and inventory and labor into Livelytics for a unified view: Aim for:
- Daily dashboard: sales, labor%, key cost signals
- Weekly performance summary
- Monthly strategic review for menu and marketing
5. Create weekly and monthly review habits
Use Livelytics dashboards in a weekly huddle to review prime cost, sales per labor hour, inventory turnover, food waste, and labor cost%, then adjust staffing and ordering. Each month, take a deeper dive into menu engineering, campaign performance, and overall guest sentiment.
6. Run small, measurable experiments
Test 3-5% price changes, limited-time items, or reactivation campaigns for lapsed guests. Track impact in Livelytics so that every experiment produces clear learning on sales, margin, and loyalty.
7. Build a culture that actually uses data
Train managers to read dashboards and transform insights into specific actions on staffing, ordering and promotions. Help FOH and BOH teams to understand how portioning, upselling, speed, and consistency affect KPIs. Encourage leaders to ask, “What does the Livelytics data say?” before making big decisions.
Conclusion
Restaurant business analytics in 2026 is not optional, rather it’s the backbone of every smart decision you make. From forecasting demand with predictive analytics, using AI for scheduling and inventory, tracking guest journeys across dine-in, delivery, and digital, the restaurants that succeed will be the ones that treat data like a daily habit and not a one-time project.
But the good part is you don’t need a data science team or a huge tech budget to start. Rather you need clear goals, a short list of meaningful KPIs, and the discipline to look at your numbers every week and every month. With small steps like tightening prime cost, improving menu mix, increasing repeat visits by a few percentage points leads to meaningful profit growth and business stability over time.
Tools like Livelytics and modern POS or BI platforms can make it possible to see what is actually happening in your business in near real time and to test changes confidently rather than any guesswork. The restaurants that thrive in 2026 will be the ones where owners, managers, and teams all consider data and use it to create better customer experiences, stronger profit margins, and more loyal guests.
Data does not replace your intuition rather it sharpens it. If you still have any query regarding the restaurant business analytics for 2026 feel free to book a demo at Livelytics and we are more than happy to assist you.