If you’re running a restaurant, this probably sounds familiar.
- Sales look fine on the POS, but cash flow feels tight.
- Labor costs jump some weeks, even when footfall hasn’t.
- Inventory runs out of fast-moving items, while slow movers quietly expire in storage.
You know something’s off, you just don’t have the time to dig through reports to find out what.
That’s where BI dashboards make a real difference. They pull sales, labor, and inventory into one simple view, so you can spot issues while they’re still fixable.
No over-analysis. No tech-heavy learning curve. Just clear numbers that answer the questions you ask every day,
- What’s actually making money?
- Where are we overspending?
- What needs attention right now?
In this blog, we’ll walk through how restaurants use BI dashboards to track sales, labor, and inventory in a practical, owner-friendly way, so decisions feel less reactive and more in control.
Also Read: How Can Business Intelligence Dashboard Help Data Collection
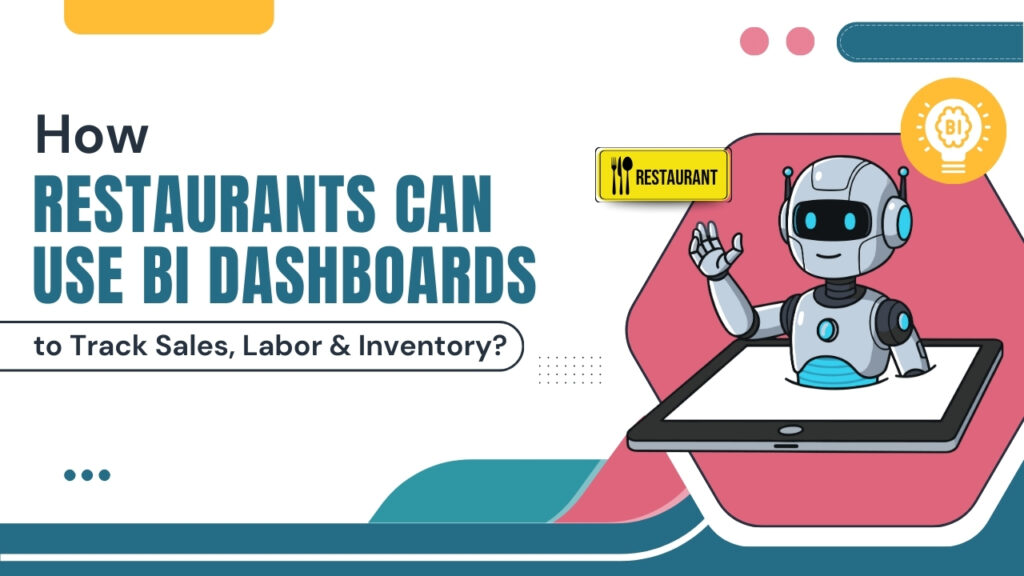
What are BI dashboards for Restaurants?
BI dashboards for restaurants are simple, visual dashboards that bring all your key business data into one place: sales, labor, inventory, and costs, so you can see what’s really happening in your restaurant without digging through multiple reports.
Let’s take a simple, real-world example.
Imagine it’s Monday morning, and you open your BI dashboard. Instead of jumping between your POS, staff schedule, and inventory sheets, everything is already in one view.
You notice three things instantly:
- Sales dipped on weekday evenings, even though footfall stayed almost the same.
- Labor costs are higher on Tuesdays and Wednesdays, especially during slow hours.
- Chicken inventory runs out by Thursday, while some other ingredients are left unused at the end of the week.
Also Read: Real-Time Dashboard Drive Smarter Business Decision
Now here’s how the dashboard actually helps.
The dashboard connects your sales data with labor schedules and inventory usage. It shows that during weekday evenings, you’re overstaffed for the volume of orders coming in. At the same time, your best-selling chicken dishes peak mid-week, but inventory ordering hasn’t adjusted to that pattern.
With this insight, you make small, practical changes:
- Adjust staff schedules on slow weekday evenings.
- Increase chicken inventory slightly mid-week instead of placing one large weekly order.
- Promote higher-margin dishes during low-sales hours.
Nothing fancy. No complex analysis. Just clear connections between sales, labor, and inventory, shown in one place. That’s the real value of a BI dashboard for restaurants: it helps you spot problems early and fix them with small decisions that protect your margins every single week.
Also Read: Restaurant Profit Margin Analytics Tool to Boost Profits
Why Restaurants Should Use BI Dashboards to Track Sales, Labor & Inventory?
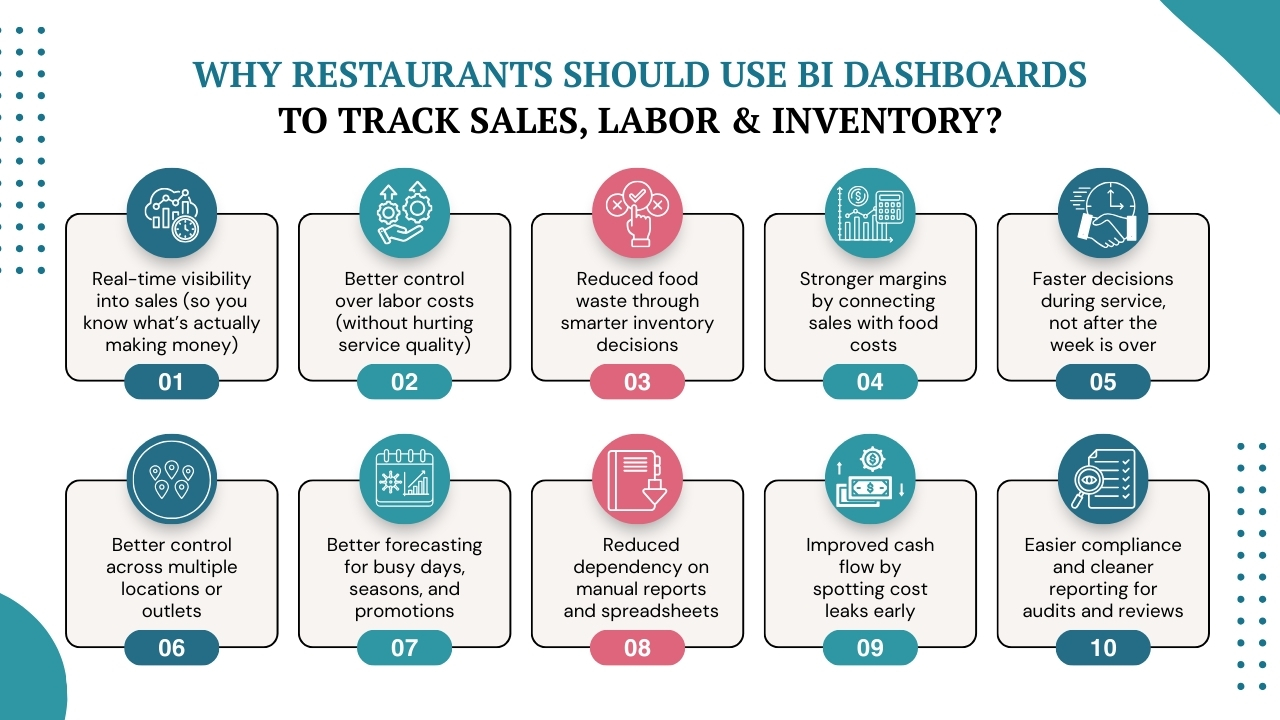
Running a restaurant today means managing thin margins, rising costs, and constant operational pressure. Yet many restaurants still rely on disconnected POS reports, manual inventory checks, and gut-based staffing decisions.
The problem isn’t a lack of data; it’s a lack of connected visibility. BI dashboards solve this by bringing everything into one real-time view, helping owners and managers catch issues early and act before profits slip away.
1. Real-time visibility into sales (so you know what’s actually making money)
Many restaurants look at sales only at the end of the day or week; by then, it’s too late to fix what went wrong. In the U.S. alone, restaurant sales are projected to reach $1.5 trillion, making competition fierce and small sales insights extremely valuable.
BI dashboards change that by showing real-time sales trends across menu items, time slots, and locations. It helps you instantly spot slow hours, best-selling dishes, and underperforming items, and adjust pricing, promotions, or menu focus while service is still running.
When you clearly see where revenue is coming from, decisions stop being reactive and start becoming intentional.
Also Read: Real-time Analytics Why Your Business Needs it
2. Better control over labor costs (without hurting service quality)
Labor is one of the biggest stress points for restaurant owners today, as it accounts for 30–36% of total restaurant sales. Wages, benefits, and scheduling inefficiencies quietly eat into profits, especially when staffing isn’t aligned with actual demand.
BI dashboards connect labor data with sales performance, helping you see exactly when you’re overstaffed or understaffed. This allows managers to fine-tune schedules, reduce unnecessary labor hours during slow periods, and still maintain service standards during peak times.
Also Read: The Complete Guide of Restaurant Business Analytics
3. Reduced food waste through smarter inventory decisions
Food waste is one of the most silent profit killers in restaurants. Restaurants typically waste 4–10% of the food they purchase, which directly impacts food cost margins.
Overstocking, poor demand forecasting, and a lack of visibility into ingredient usage lead to spoilage long before the issue is noticed.
BI dashboards solve this by tracking inventory movement alongside sales data, making waste patterns visible instead of hidden. Business owners can identify slow-moving ingredients, over-ordering trends, and mismatches between menu demand and stock levels.
This allows restaurants to adjust ordering cycles, portion sizes, and menu planning, reducing waste before it hits the bin.
How KFC Australia Forecast-Driven BI Dashboards for Labor & Inventory and Achieved 95% Demand Forecasting Accuracy?
KFC Australia faced inaccurate demand forecasting, leading to food waste, stockouts during peak periods, and inefficient labor scheduling. Forecasts were rigid and did not reflect real-time or location-specific demand patterns.
How they leveraged BI dashboards
KFC implemented BI dashboards powered by advanced forecasting tools that combined historical sales, time-of-day trends, and local factors.
- Sales forecasts broken into 15-minute intervals
- Inventory planning aligned directly with predicted demand
- Labor scheduling dashboards ensured staffing matched real sales patterns
Results generated
- Achieved 95% demand forecasting accuracy
- Reduced food waste and improved stock availability
- Better labor utilization without compromising service quality
Also Read: AI for Reducing Restaurant Waste
4. Stronger margins by connecting sales with food costs
Food costs typically account for 28–35% of total restaurant revenue, so even small inefficiencies add up quickly. Most restaurants know their food cost percentage, but not what’s driving it. Without connected data, low-margin dishes continue to sell, discounts get applied blindly, and portion issues stay hidden.
BI dashboards link menu-level sales with ingredient usage and food costs, making it clear which items actually contribute to profit and which ones quietly hurt margins. With this data, restaurant owners can spot low-margin items early, rework recipes, adjust pricing, or push higher-margin dishes at the right time.
Also Read: How to Calculate Food Cost Percentage
5. Faster decisions during service, not after the week is over
Traditional reports tell you what happened after the damage is done. BI dashboards work differently. They update in near real time, giving managers visibility while the service is still running. This matters because restaurant operations move fast.
According to industry studies, operators who actively track KPIs like sales per labor hour and food cost percentages make quicker adjustments and reduce operational inefficiencies significantly.
For example, if sales dip unexpectedly, labor spikes, or inventory moves faster than planned, action can be taken immediately, not days later.
Also Read: How Restaurant Business Intelligence Helps Owners Make Faster Decisions
6. Better control across multiple locations or outlets
For multi-location restaurants, consistency is one of the hardest challenges. One outlet performs well, another struggles, but without unified visibility, it’s hard to understand why.
BI dashboards give owners and regional managers a centralized view of sales, labor, and inventory across all locations.
This makes it easier to compare performance, identify best practices, and spot problem areas early. With the restaurant industry becoming increasingly competitive and multi-unit operations growing rapidly, centralized reporting is no longer optional; it’s essential for scaling without losing control.
Also Read: Customer Sentiment Analytics for Multi-location Businesses
7. Better forecasting for busy days, seasons, and promotions
Most restaurants struggle during sudden spikes, weekends, festivals, holidays, or promotions. Studies show that a small number of peak days can contribute a large share of weekly revenue. Without historical patterns, forecasting becomes guesswork.
BI dashboards use past sales, labor, and inventory data to highlight trends, helping restaurants prepare more accurately for demand. This is important because customer traffic isn’t evenly distributed. Forecasting helps restaurants avoid understaffing, stockouts, and last-minute purchasing at higher costs.
Also Read: How Restaurants Can Predict Trends With Analytics
8. Reduced dependency on manual reports and spreadsheets
Manual reporting takes time and time is expensive in restaurant operations. Many managers spend hours pulling POS data, updating spreadsheets, and reconciling numbers that are already outdated by the time they’re reviewed. BI dashboards automate this process by updating data automatically and presenting it visually.
According to industry research, automation and digitization can significantly reduce reporting errors and operational delays, freeing managers to focus more on service quality and customer experience.
Also Read: How to Improve Restaurant Operations
9. Improved cash flow by spotting cost leaks early
Cash flow issues in restaurants rarely come from one big mistake, they come from multiple small leaks. This is critical because nearly 60% of restaurants say cash flow is their top operational challenge, especially in high-cost environments.
Slight over-ordering, extra labor hours, unnecessary discounts, or slow-moving inventory can quietly strain cash flow. Without BI dashboards, these issues often go unnoticed until there’s pressure on payroll or vendor payments.
BI dashboards surface these leaks early by tracking sales, costs, and inventory movement together. Early visibility helps owners act before cash flow becomes a problem and ensure smooth operations.
Also Read: Key Metrics Restaurant Owner Should Be Tracking
10. Easier compliance and cleaner reporting for audits and reviews
Whether it’s internal reviews, investor discussions, or compliance checks, pulling clean and consistent data is often a headache for restaurants. Manual reports increase the risk of errors and inconsistencies. BI dashboards centralize data and maintain a single source of truth across sales, labor, and inventory.
As restaurants adopt more digital systems, accurate and centralized reporting has become essential for financial transparency and operational reviews. BI dashboards simplify this process, saving time and reducing reporting stress for owners and managers alike.
How Restaurants Can Use BI Dashboards to Track Sales, Labor, Inventory & Other Crucial Metrics
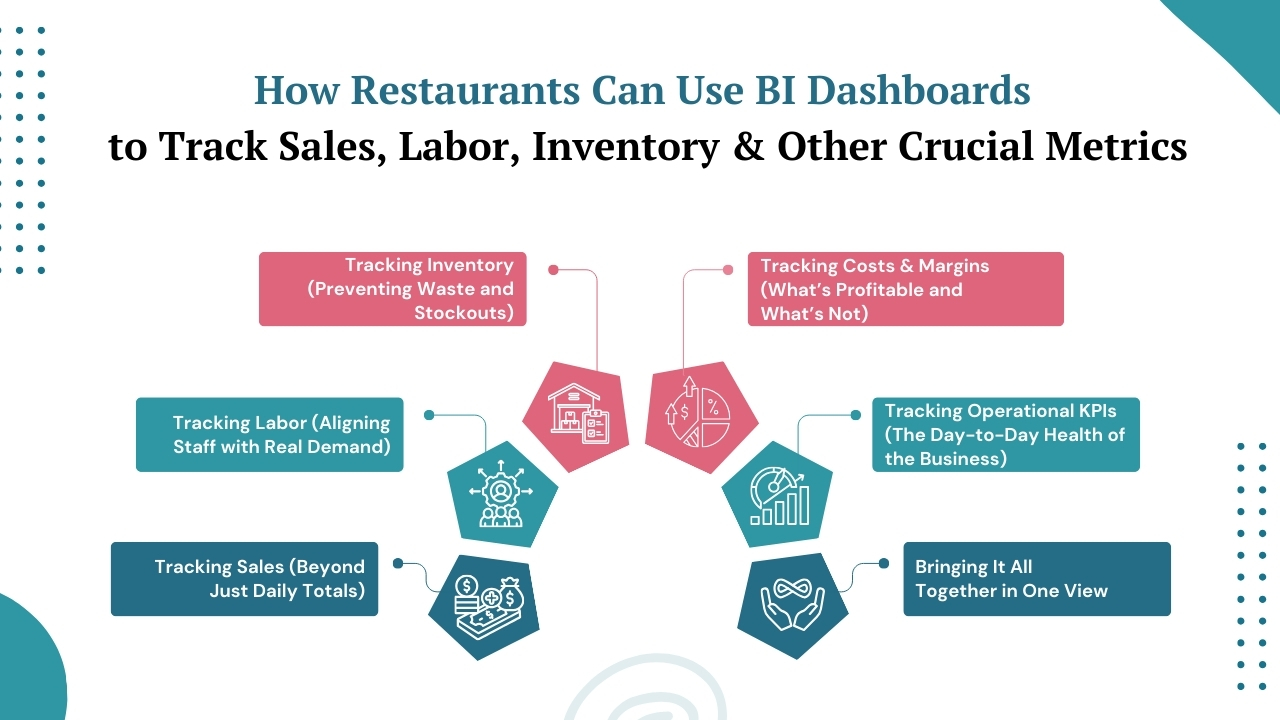
BI dashboards work best when they mirror how a restaurant actually runs—day by day, shift by shift. Instead of looking at numbers in isolation, they help owners and managers see how sales, labor, inventory, and operations affect each other in real time.
Here’s how restaurants practically use BI dashboards across key areas:
1. Tracking Sales (Beyond Just Daily Totals)
BI dashboards break sales down into meaningful views, by hour, shift, menu item, category, or location. This helps restaurants identify peak hours, slow periods, and top-performing dishes instead of relying only on end-of-day reports.
For example,
- managers can see which items drive revenue during lunch vs dinner,
- which days consistently underperform,
- and whether promotions actually increase profitable sales, not just order volume.
This allows for smarter pricing, menu focus, and promotional planning.
How Hash House A Go Go are Leveraging BI Dashboards for Menu & Inventory Optimization & Achieved 3% to 5% Reduction in Costs?
Hash House A Go Go lacked visibility into which menu items were profitable and how inventory decisions affected margins. Inventory checks were time-consuming and inconsistent.
How they leveraged BI dashboards
They implemented BI dashboards connecting sales data with recipe costing and inventory usage.
- Tracked sales by hour to restructure operating hours
- Identified underperforming signature items impacting margins
- Shifted from periodic inventory counts to weekly inventory tracking
Results generated
- 3–5% reduction in inventory costs
- Improved menu profitability decisions
- Faster and more accurate inventory processes
Also Read: How AI Helps in Boosting Restaurant Revenue and Profits
2. Tracking Labor (Aligning Staff with Real Demand)
Rather than viewing labor costs separately, BI dashboards connect staffing data directly with sales performance. Restaurants use this to track labor cost percentage, sales per labor hour, and shift-level efficiency.
This makes it easier to adjust schedules based on real demand patterns, cutting excess hours during slow periods and ensuring proper coverage during peak times. Over time, this leads to better cost control without compromising service quality.
3. Tracking Inventory (Preventing Waste and Stockouts)
BI dashboards monitor inventory movement alongside sales data. Restaurants can see how fast ingredients are being used, which items move slowly, and where over-ordering or under-ordering happens.
This helps teams place smarter orders, adjust prep quantities, and reduce food waste. When inventory aligns with actual sales trends, kitchens stay prepared without tying up cash in excess stock.
Also Read: AI for Retail Inventory Management
4. Tracking Costs & Margins (What’s Profitable and What’s Not)
Beyond sales and inventory, BI dashboards help restaurants track food cost percentage, contribution margins, and cost trends over time. By connecting ingredient costs with menu performance, it becomes easier to spot low-margin dishes and rising supplier costs.
This insight supports better menu engineering, deciding what to promote, reprice, or refine, based on profitability, not assumptions.
How McDonald’s is Using BI Dashboards for Real-Time Sales & Operations Control?
With thousands of outlets operating independently, McDonald’s struggled with inconsistent reporting, delayed insights, and limited visibility into store-level performance. Managers often relied on end-of-day or end-of-week reports, making it hard to act quickly on sales dips, labor inefficiencies, or inventory issues.
How they leveraged BI dashboards
McDonald’s implemented enterprise BI dashboards that pulled data from POS systems, operations tools, and supply chain systems into a single real-time view.
- Dashboards tracked sales by hour, menu mix, and promotions across locations
- Operations scorecards compared store performance against benchmarks
- Managers accessed daily inventory and labor insights to adjust staffing and prep dynamically
Results generated
- 10% reduction in average drive-through service time, improving customer experience
- Faster operational decisions across 4,000+ North American outlets
- Improved consistency in inventory availability and staffing efficiency
Also Read: Cost Effective AI Solutions for Restaurants
5. Tracking Operational KPIs (The Day-to-Day Health of the Business)
Restaurants also use BI dashboards to monitor crucial operational metrics like average order value, table turnover, discount usage, and voids or comps. These indicators highlight operational inefficiencies and revenue leakage that often go unnoticed in traditional reports.
Having these metrics in one dashboard gives managers a quick health check of the business, before small issues become recurring problems.
Also Read: How to Setup Key Performance Indicators KPIs for your Business
6. Bringing It All Together in One View
The real power of BI dashboards isn’t in individual metrics, it’s in how everything connects.
- Sales trends inform labor decisions.
- Inventory data supports menu planning.
- Cost insights protect margins.
Instead of reacting after the fact, restaurants can make informed decisions while operations are still in motion. That’s how BI dashboards move restaurants from firefighting to foresight, using data not as a report, but as a daily operational tool.
How Livelytics Helps Restaurants Track Sales, Labor & Inventory with BI Dashboards?
Restaurants don’t need more reports, they need one clear view of what’s happening across sales, labor, and inventory. That’s exactly where Livelytics fits in.
Livelytics is an AI-powered intelligence platform designed for modern restaurants that want clarity, foresight, and action from their data. Let’s find out more about it:
A Single Source of Truth for Your Restaurant
Restaurants rely on multiple systems every day, but Livelytics unifies all of them into one connected BI platform.
- Operational Excellence – See what’s slowing you down and fix it fast, from kitchen flow to daily operations. And, it helps with:
- Menu Management – Know what’s selling, what’s not, and where margins need attention.
- Marketing Management – Track what campaigns actually bring in sales, not just clicks or footfall.
- Customer Experience Management – Understand guest behavior and improve service where it matters most.
- Inventory Management – Stay on top of stock, cut waste, and order smarter based on real demand.
AI-Powered Restaurant Intelligence
Livelytics AI helps restaurants move beyond reporting and into predictive, intelligent decision-making.
- Uncover hidden patterns to identify top-performing dishes, slow movers, and menu gaps in real time.
- Improve profitability by pinpointing where costs rise, waste occurs, or margins can be improved.
- Replace gut-based decisions with confidence, backed by live data.
- Optimize operations using AI-driven recommendations that improve efficiency and guest experience.
Instant, Data-Driven Answers with LivAI
With LivAI, Livelytics’ AI assistant, restaurant teams get instant clarity without digging through dashboards or reports.
- Know what’s selling and track menu performance effortlessly.
- View real-time insights on sales, operations, and customer behavior at a glance.
- Refine pricing, marketing, and business strategies with clear, actionable data.
- Resolve operational issues faster with AI-guided insights that keep daily performance on track.
Connect with over 650+ connectors
Livelytics supports 650+ connectors, allowing restaurants to move data automatically, securely, and reliably between systems, data warehouses, and analytics environments. This ensures accurate insights without manual intervention or technical complexity.
Powerful Insights Without the Complexity
Built for restaurant owners and managers, not data teams. Dashboards are simple, visual, and easy to understand, so you get answers without digging through complex reports.
Cost-Effective BI That Delivers Real Control Within Budget
Replaces multiple tools with one platform, helping you reduce software costs while gaining better control over labor, inventory, and operations.
Start Your Journey with Livelytics
From the heart of your kitchen to every customer interaction, Livelytics helps restaurants turn data into action.
- Set up quickly
- Personalize to your operations
- Get actionable insights
- Optimize and scale with confidence
Book a free demo and see how Livelytics brings intelligence, efficiency, and control to your restaurant operations.
Wrap Up!
Throughout this blog, we’ve seen how restaurants struggle when sales, labor, inventory, and operational data live in silos. Reports come in late, insights arrive after the damage is done, and decisions often rely on instinct instead of clarity. What restaurants need is not more data, but a way to make sense of it, in real time.
That’s where Livelytics fits in. Livelytics is an AI-powered business intelligence platform built specifically for restaurant businesses. It brings data from different tools, so teams can see what’s happening in real time, keeping restaurant owners and managers stay in control and plan ahead with confidence without adding complexity to their day-to-day workflow.
To know more Livelytics and how it fits into your business processes, book a free demo today.