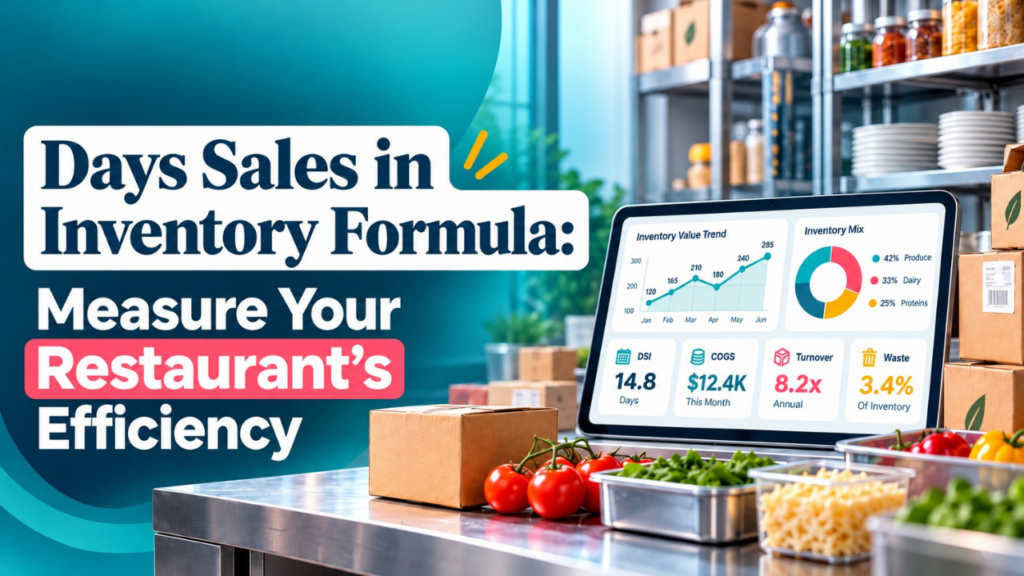

Managing inventory efficiently is essential for restaurant profits, cost control, and customer satisfaction. If there is excess stock, storage expenses and food waste while insufficient supplies can cause stockouts and lost sales.
The Days Sales in Inventory(DSI) formula helps restaurant owners measure how many days of inventory they hold relative to their cost of goods sold(COGS), offering insights into inventory efficiency and purchasing practices.
Understanding Days Sales in inventory enables restaurant managers to evaluate average inventory, track inventory turnover, and make informed purchasing decisions.
By analyzing inventory levels along with sales trends, helps restaurants to identify potential overstocking and improve working capital management.
However, an appropriate day sales in inventory depends on ingredient shelf life, supplier delivery schedules, seasonal demand, and daily operational requirements. Restaurants should balance inventory reduction with maintaining sufficient stock to serve customers consistently.
Combining food cost analysis and waste tracking with Days sales in inventory provides a complete picture of business performance.
Livelytics can help restaurants to analyze available operational data and restaurant business analytics to reveal trends, track performance, and identify areas for improvement.
This blog will walk you through the Days sales in inventory formula, show how to calculate DSI, and explore practical strategies for improving restaurant inventory management.
With accurate records and regular monitoring, restaurants can reduce unwanted waste, control expenses, and support sustainable growth.
Also Read: AI For Restaurant Inventory
What Is Days Sales in Inventory (DSI)?
Days Sales in inventory(DSI) is a financial metric that estimates the average number of days a business takes to sell its inventory. It is also known as Days Inventory Outstanding(DIO), days in inventory, or average inventory age.
This metric compares the average value of inventory held during a period with the cost of goods sold(COGS) during that same period. It indicates how many days of inventory the business holds at its average rate of consumption or sales cost.
For restaurants, DSI helps managers to understand whether ingredients and other inventory items are moving efficiently. A higher result may indicate excess inventory as compared to consumption, whereas a lower result may indicate quicker stock turnover.
For instance, a restaurant that regularly purchases fresh vegetables but uses them slowly may experience unnecessary food spoilage. Tracking inventory days can encourage managers to review order quantities, storage practices, and menu demand.
However, a lower Days sale in inventory is not always better. Restaurants must maintain enough ingredients to meet customer demand, handle supplier delays, and prepare popular dishes. The goal is to find a suitable balance between inventory availability and the cost of holding stock.
Also Read: Restaurant Sale Forecasting How to Predict Future Revenue
How to Calculate Days Sales in Inventory for Restaurants
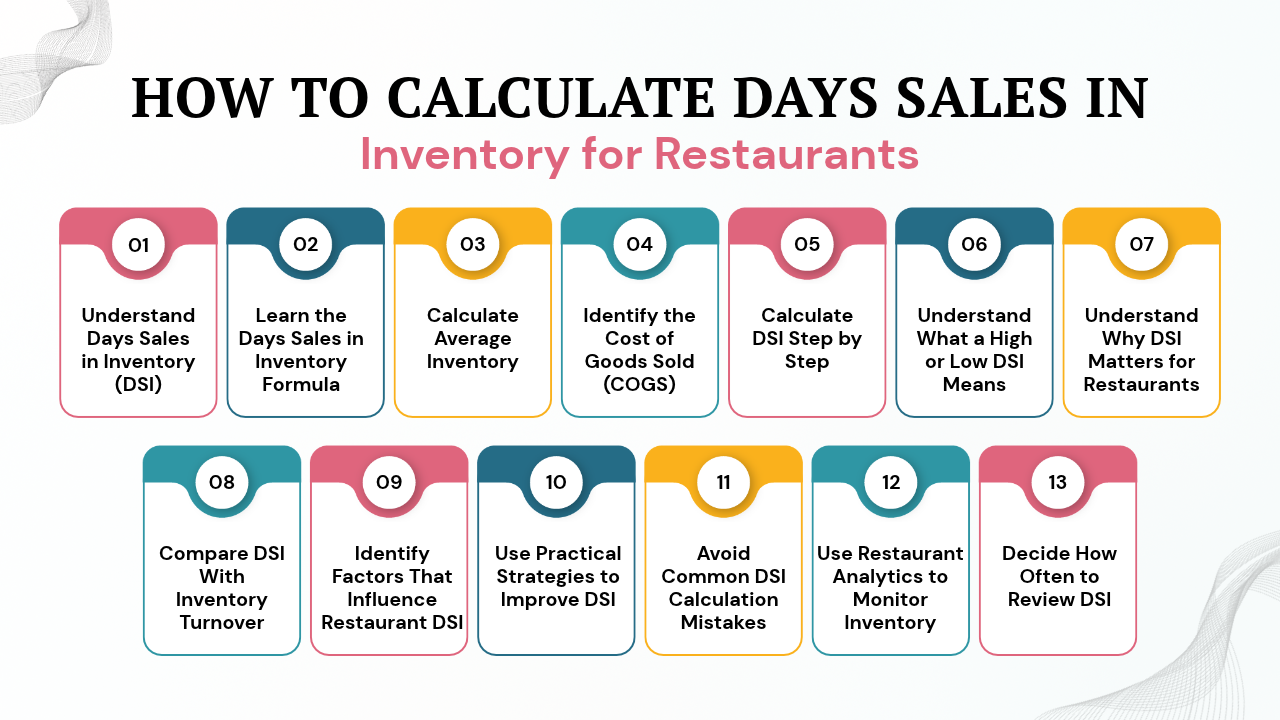
Restaurant inventory management is essential for controlling expenses, reducing food waste, and maintaining profits. Stocking too much inventory can increase storage costs and food spoilage while insufficient inventory can cause stockouts and missed sales.
While the days sales in inventory(DSI)formula helps restaurant owners the number of days their average inventory represents based on the cost of goods sold(COGS).
Tracking days sales in inventory regularly helps restaurants to check ingredient purchasing practices, understand inventory movement, and find opportunities to improve working capital management.
However, the best DSI is based on the restaurant’s menu, ingredient shelf life, supplier schedules, and customer demand. Below are the practices to calculate DSI step by step, understand the result, and use the information to improve efficiency of restaurant inventory.
1. Understand Days Sales in Inventory (DSI)
Days Sales in Inventory (DSI), also called Days Inventory Outstanding (DIO), shows the number of days a business’s average stock can cover its cost of goods sold.
For restaurants, DSI gives a financial overview of inventory. This helps managers to understand the amount of money being invested in food, beverages, packaging, and other stock as compared to the cost of items used or sold.
For instance, a high DSI may indicate that a restaurant holds more inventory than necessary, while a lower DSI may indicate faster inventory movement. Both high DSI and lower DSI may be neither good or bad because restaurants require sufficient stock to meet customer demand.
Also Read: AI For Restaurant Inventory
2. Learn the Days Sales in Inventory Formula
The standard formula for calculating DSI is:
DSI = (Average Inventory ÷ Cost of Goods Sold) × Number of Days in the Period
For yearly calculations, the duration is usually 365 days. For calculating DSI for a quarter, they must use the actual number of days in the selected period.
This formula uses inventory that are valued at cost and COGS from the same period. Consistently tracking these figures helps to ensure that the result is impactful.
Also Read: How to Create an Effective Restaurant Daily Sales Report
3. Calculate Average Inventory
Before applying the DSI formula, calculate the restaurant’s average inventory to estimate the stock held during a specific period.
Formula:
Average Inventory = (Beginning Inventory + Ending Inventory) ÷ 2
Beginning inventory is the stock value at the beginning, while ending inventory is the stock value at the end.
For example, if a restaurant begins with $8,000 in inventory and ends with $12,000, the calculation is:
Average Inventory = ($8,000 + $12,000) ÷ 2
Average Inventory = $10,000
Calculating average inventory provides a basic estimate of inventory levels. However, seasonal changes and changes in purchasing may affect accuracy. Restaurants with varying stock levels can use either weekly or monthly inventory counts to get a more accurate average.
Also Read: How Inventory Software for Restaurant Reduces Food Cost
4. Identify the Cost of Goods Sold (COGS)
Cost of goods sold (COGS) indicates the direct cost of the inventory used to produce the goods sold during a period. It includes the expenses of food and beverage ingredients consumed in preparing items sold to customers.
Based on the accounting method, inventory adjustments and purchases must be recorded regularly to calculate COGS accurately.
A simplified inventory-based calculation is:
COGS = Beginning Inventory + Purchases − Ending Inventory
For example, if a restaurant starts with $15,000 in inventory, purchases $175,000 in stock, and ends with $10,000, its COGS is:
$15,000 + $175,000 − $10,000 = $180,000
This example assumes that the figures are appropriately adjusted for the accounting of the businesses. Restaurants must use consistent inventory categories and accounting periods while calculating COGS and DSI(Days sales in inventory).
Also Read: The Blind Spots Costing Your Business More Than You Think
5. Calculate DSI Step by Step
Consider a restaurant that wants to evaluate its annual inventory efficiency. It records beginning inventory of $15,000, ending inventory of $21,000, annual cost of goods sold (COGS) of $180,000, and a 365-day period.
Initially restaurants must calculate the average inventory by adding the beginning and ending inventory values and dividing the total by two. The calculation is ($15,000 + $21,000) ÷ 2, resulting in an average inventory of $18,000.
Next, divide the average inventory by annual COGS. Dividing $18,000 by $180,000 gives 0.10. Multiply this result by 365 days to calculate DSI: 0.10 × 365 = 36.5 days.
Therefore, the restaurant’s Days Sales in Inventory (DSI) is 36.5 days. It indicates that its average inventory value is approximately 36.5 days of COGS at the annual rate.
This does not indicate that every ingredient is in storage for exactly that duration. Restaurant managers can use this result to review stock levels, purchasing frequency, supplier schedules, and sales patterns to find opportunities to improve inventory efficiency.
Also Read: Technology in the Restaurant Industry
6. Understand What a High or Low DSI Means
Understanding DSI requires considering the restaurant’s operations instead of relying only on a universal target.
A high DSI may indicate that inventory is moving slowly or that the restaurant has higher stock storage than necessary. This can increase inventory storage expenses, tie up working capital, and increase the risk of spoilage, especially perishable ingredients.
However high DSI may also indicate bulk purchasing discounts, seasonal food preparation, long supplier lead times, or the need to maintain a broader food menu.
A low DSI may indicate faster inventory movement and ensure that less money is stuck up in inventory stock. However if inventory levels become low, then the restaurant may experience stockouts, emergency purchases, menu limitations, or missed sales.
Managers should compare DSI with previous periods, supplier delivery schedules, food waste, and customer demand before choosing whether adjustments are necessary.
Also Read: The Future of Restaurant and Retail Decision Intelligence
7. Understand Why DSI Matters for Restaurants
Tracking Days Sales in Inventory (DSI) helps restaurants to make informed decisions regarding inventory management, purchasing, and cost control. Understanding the quantity of inventory they hold as compared to consumption, helps restaurant owners to identify areas that need improvement and manage resources more effectively.
An important benefit is controlling inventory expenses by identifying excess stock levels that may exceed operational needs. Tracking DSI regularly can also help to reduce food by highlighting slow-moving ingredients and encourages better stock rotation.
Additionally, understanding inventory levels helps restaurants to improve cash flow by showing the amount of money is stuck up in supplies rather than available for other expenses.
DSI also supports purchasing decisions, letting managers to align order quantities with customer demand and supplier delivery schedules. Maintaining appropriate stock levels helps to prevent stock shortages of popular menu items.
Further, comparing DSI results over time lets restaurants evaluate performance of inventory and analyze unusual changes.
For a complete picture, they must combine DSI with food cost percentage, inventory turnover, stockout frequency, and food waste tracking. Together these metrics provide more useful insights into inventory efficiency of restaurants.
Also Read: Best Restaurant Business Intelligence Software for Growing Business
8. Compare DSI With Inventory Turnover
Days Sales in Inventory (DSI) and inventory turnover are closely interconnected metrics that help restaurants to evaluate performance of inventory. However, each metric provides different information.
Inventory turnover measures the quantity of inventory used or sold during a certain period, while DSI estimates the number of days represented by average inventory.
The standard inventory turnover formula is:
Inventory Turnover = COGS ÷ Average Inventory
Using the earlier example, annual COGS is $180,000 and average inventory is $18,000. Dividing $180,000 by $18,000 gives an inventory turnover rate of 10 times per year.
To calculate DSI, divide the number of days in the year by inventory turnover: 365 ÷ 10 = 36.5 days.
All these results provide insights. Inventory turnover highlights inventory cycles through operations, whereas DSI expresses inventory coverage in days.
Restaurant managers should interpret both measures along with menu requirements, storage capacity, supplier lead times, and customer demand to make balanced purchasing decisions and maintain appropriate stock levels.
Also Read: Optimize Table Turnover Using Analytics
9. Identify Factors That Influence Restaurant DSI
Several operational factors affect a restaurant’s Days sales in inventory(DSI) and determine the quantity of stock levels that they need to maintain. Understanding these factors helps managers to evaluate inventory performance and make informed purchasing decisions.
- Menu composition: Restaurants serving fresh seafood, dairy products, and vegetables may need frequent deliveries, while those restaurants using frozen or shelf-stable ingredients may maintain large reserves.
- Supplier schedules: Frequent deliveries may require lower inventory levels whereas longer lead times may require additional stock to prevent stock shortages.
- Seasonal demand: Holidays, special events, and tourism can increase customer demand and may change purchasing requirements.
- Storage capacity: Less refrigeration and dry storage space can reduce the amount of inventory that a restaurant can safely maintain.
- Purchasing discounts: Bulk purchasing may increase average inventory, even while it reduces the cost per unit.
- Menu variety: Restaurants with a variety of food menus may need more ingredients than establishments providing fewer dishes.
Considering these factors, helps restaurant managers to determine whether their DSI results indicate inefficiencies or show genuine operational needs. This supports better stock control, purchasing, and waste management.
Also Read: Optimizing a Restaurant Menu With AI Powered Data Analytics
10. Use Practical Strategies to Improve DSI
Restaurants can improve Days Sales in Inventory (DSI) by effectively managing purchasing, storage, and ingredient use more effectively. While the goal is to maintain sufficient stock levels and reduce unnecessary food expenses and food waste.
Forecast demand involves using sales history, reservations, seasonal patterns, and upcoming events to estimate requirements of ingredients. They can establish par levels by setting minimum and maximum quantities for important ingredients helping to avoid overstocking and shortages.
Restaurants must apply the first-in, first-out (FIFO) method so that the older stock is used before newer stock whenever it is appropriate. Slow-moving ingredients must regularly review slow-moving ingredients and adjust purchasing quantities or food menu planning to reduce unused supplies.
It is essential to coordinate with suppliers to discuss delivery schedules, minimum order quantities, and flexible purchasing arrangements. They must track food spoilage, food preparation waste, and unsold food to identify recurring problems. Further they must track food spoilage, food preparation waste, and unsold food to identify recurring problems.
Additionally they must standardize food recipes and portion sizes to make ingredient consumption more predictable.
They must review purchasing patterns regularly and adjust food orders when customer demand changes. The objective of restaurants is not to achieve the lowest DSI but to balance inventory expenses and food waste reduction with product availability, food quality, and customer satisfaction.
Also Read: Data-Driven Social Media Strategies for Your Business
11. Avoid Common DSI Calculation Mistakes
Accurate Days Sales in Inventory (DSI) calculations is based on consistent financial data and correct inventory valuation. Restaurants should avoid common mistakes that can affect results and cause poor purchasing decisions.
- Using inconsistent periods: Ensure inventory figures and cost of goods sold (COGS) cover the same period. Comparing monthly inventory with annual COGS without adjusting the calculation can produce misleading results.
- Using selling prices instead of cost: Inventory should generally be valued at its purchase or production cost rather than menu selling prices.
- Ignoring inventory changes: Beginning and ending inventory may not capture fluctuations throughout the period. More frequent stock counts can improve estimates when inventory levels vary significantly.
- Mixing inventory categories: Apply consistent categories when valuing inventory and calculating COGS to maintain reliable comparisons.
- Assuming lower is always better: A very low DSI may indicate insufficient stock, increasing the risk of stockouts and emergency purchases.
- Ignoring seasonality: Compare similar periods when holidays, tourism, or special events influence demand.
By avoiding these mistakes, restaurant managers can interpret DSI more accurately, identify inventory issues, and make better-informed purchasing decisions. Regularly reviewing calculations also helps maintain consistent reporting and supports effective inventory management.
Also Read: Fast Food Accounting Software for Restaurants
12. Use Restaurant Analytics to Monitor Inventory
Calculating DSI manually helps restaurants understand inventory efficiency, but regularly tracking sales, purchasing, and stock data can offer a complete picture of operational performances.
Restaurant analytics help managers to identify changes, investigate unusual patterns, and make informed inventory decisions.
Analytics tools may integrate available sales, inventory, and financial information to support performance reviews. Based on the system and its integration, reports can show inventory purchasing patterns, high-cost ingredients, unexpected stock changes, and differences between expected and actual consumption. These insights can help managers identify potential inefficiencies and adjust purchasing practices.
Livelytics offers restaurant analytics solutions that help businesses to gain operational and performance insights. Based on the available integrations and configuration, its tool may complement inventory reviews that help managers to evaluate valid business data and recognize trends that need further investigation.
Before choosing an analytics platform, restaurants must confirm its system compatibility, data access requirements, and available reporting features. They must remember that analytics supports decision-making but it does not replace accurate stock levels, reliable COGS calculations, or consistent accounting practices.
Integrating reliable data with regular DSI reviews help restaurants to make better-informed purchasing and inventory management decisions.
Also Read: Restaurant Analytics and Reporting
13. Decide How Often to Review DSI
The ideal Days Sales in Inventory (DSI) review schedule is based on the size of restaurants, food menu complexity, inventory value, and daily operations. Restaurants must establish a consistent schedule that helps managers to track stock levels and identify problems before they affect service.
Restaurants handling highly perishable ingredients, such as seafood, dairy products, and fresh vegetables, may require frequent stock checks and regular food waste reviews.
While smaller restaurants with stable menus and predictable customer demand may find weekly operational reviews and monthly financial calculations sufficient.
Annual DSI calculations support long-term performance comparisons, but it may hide short-term changes in purchasing patterns or customer demand. Calculating DSI monthly or quarterly helps managers to identify emerging trends and adjust inventory practices whenever necessary.
They must use the same calculation method and consistent reporting periods for reliable comparisons. Any unusual circumstances like seasonal stockpiling, supplier disruptions, special events, and unexpected demand changes. Such context helps managers to understand why DSI levels have changed instead of assuming every variation indicates a problem.
Regular reviews helps restaurants to maintain appropriate stock levels, control inventory costs, and make better-informed purchasing decisions.
Conclusion
Managing restaurant inventory efficiently is essential for controlling food expenses, reducing food waste, and maintaining consistent services. Restaurants must balance that enough ingredients meet customer demand while also avoiding excess stocking and the cash stuck and also increase food spoilage risks.
The Days Sales in Inventory (DSI) formula helps restaurant owners understand how much inventory they hold relative to their cost of goods sold (COGS) over a specific period.
By calculating Days Sales in Inventory, managers can estimate the number of COGS their average inventory represents. Such information can help to identify if there is overstocking, review purchasing schedules, and evaluate inventory management practices.
However, an appropriate DSI level varies depending on the restaurant’s menu, ingredient shelf life, supplier delivery schedules, and seasonal demand.
Understanding the DSI formula, its calculation, and its practical applications lets restaurant operators make more informed decisions about purchasing and stock control. Comparing DSI consistently over certain duration can reveal changes in inventory performance and highlight areas that need further investigation.
This blog covers the way to calculate DSI step by step, interpret the results, understand the factors that affect the metric, and apply practical strategies to improve restaurant inventory efficiency. Platforms like Livelytics may also support restaurants to make data-informed operational decisions.
If you still have any query about day sales in inventory formulas and measure your restaurant’s efficiency, then you may book a free demo at Livelytics and we are more than happy to assist you.