You know your restaurant. You know your menu, your regulars, your busiest hours, your best staff. Now, you think you know everything.
But, knowing your restaurant and knowing how your restaurant is actually performing are two different things.
And the gap between the two? That’s where most of the money goes unnoticed.
This is exactly why restaurant performance metrics exist. It acts as a practical tool for owners who want real answers.
- Are my regulars really coming back?
- Are my marketing strategies compounding?
- Is my labour actually aligned with my revenue?
- Which part of my menu is working and which isn’t?
These are questions that gut feeling can’t reliably answer. But your data can.
The good news is that data analytics in restaurants has come a long way. Modern AI restaurant analytics tools and restaurant analytics and reporting systems now give owners the kind of visibility they need to make data-driven decisions.
But the tools only work if you know what to track.
That’s what this blog covers. 12 restaurant performance metrics every owner should have full visibility on and if you’re already wondering how to track all of this without drowning in spreadsheets, we’ve got you covered at the end.
Also Read: The ROI of Restaurant Business Intelligence
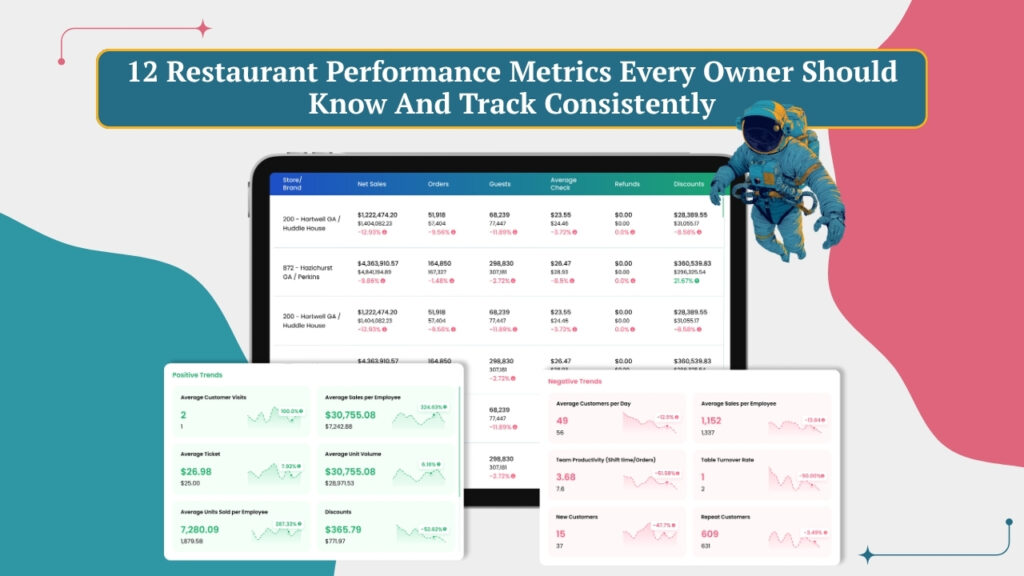
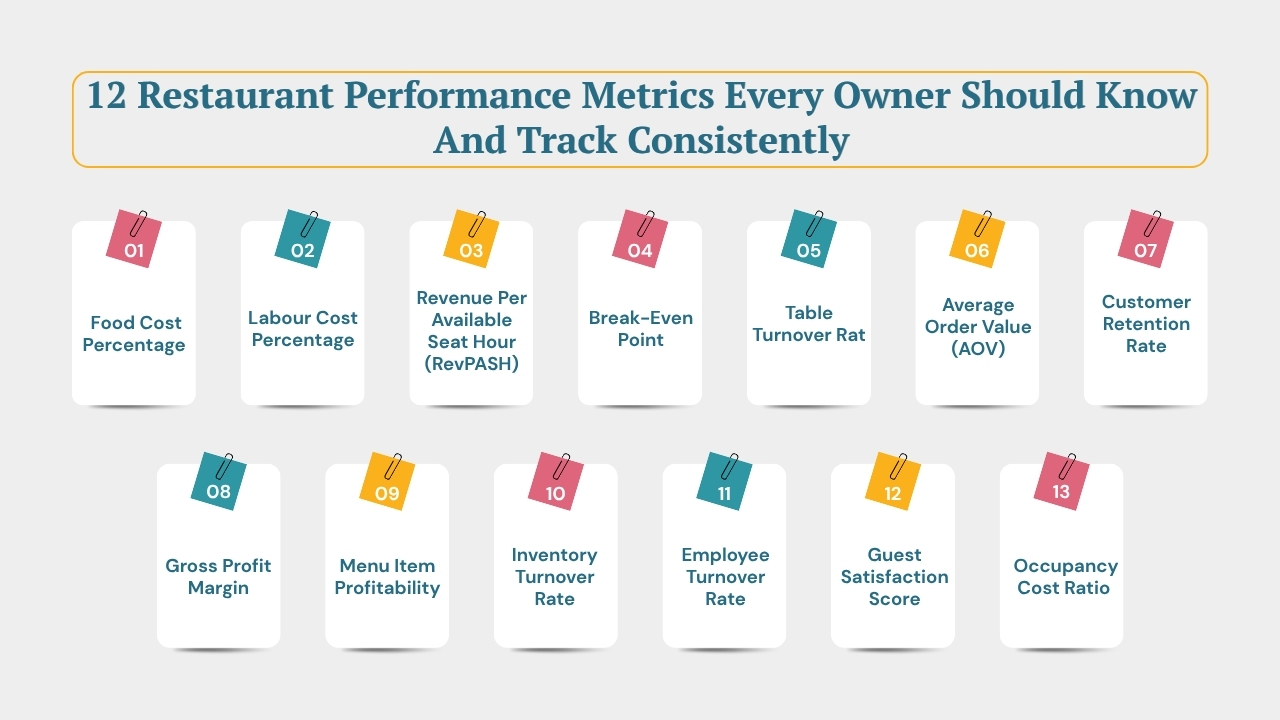
12 Crucial Restaurant Performance Metrics that Every Restaurant Owner Should Track!
Most restaurants track revenue. Some track food cost. Very few track the full picture and that gap is exactly what separates restaurants that grow from restaurants that struggle despite being busy.
Below are the 12 restaurant performance metrics that give you that full picture. Here’s what you should be tracking and why each one matters more than you think.
1. Food Cost Percentage
Food cost percentage tells you how much of your total revenue is being spent on ingredients. The formula is simple, divide your food costs by your food sales and multiply by 100. Most restaurants aim to keep this between 28% and 35%.
The tricky part? This number doesn’t spike overnight. It creeps little by little. And, over a few weeks, your food cost has quietly jumped and your profits have quietly shrunk.
Together, they push your food cost from 30% to 36% and on $60,000 monthly revenue, that’s $3,600 extra gone every month. $43,200 a year. From a number nobody was watching.
Why it matters:
- Shows which dishes cost more to make than they’re worth on the menu
- Helps you price your menu based on real numbers, not guesswork
- Gives you a clear weekly and monthly benchmark to measure against
Tracking this consistently with a good restaurant analytics and reporting tool means you catch that drift early, not when the damage is already done.
Also Read: How to Calculate Food Cost Percentage
2. Labour Cost Percentage
Labor is another biggest expense contributor after food and the labor cost percentage measures what portion of your revenue goes to your team and you have to keep it between 25%–35%.
But, scheduling by habit is one of the most expensive things a restaurant owner does. Same shifts. Same headcount. Week after week. Regardless of whether it’s a packed Friday or a dead Tuesday.
A restaurant doing $60,000 a month at 38% labour cost is spending $22,800 on wages. Get that to 30% through smarter scheduling, not cutting staff, just putting the right number on at the right time and $4,800 stays in the business every month.
Why it matters:
- Shows whether your staffing actually matches your revenue and cover count
- Highlights overtime that’s adding cost without adding real value
- Identifies your most and least efficient shifts across the week
- Helps multi-location owners compare labour efficiency across different sites
Restaurant business intelligence tools that connect your sales data to your scheduling take the guesswork out of this completely.
Also Read: The Blind Spots Costing Your Business More Than Your Think
3. Revenue Per Available Seat Hour (RevPASH)
Two restaurants. Both 60 seats. Both open Friday dinner.
- Restaurant A: $7,200 over four hours = $30 per seat per hour
- Restaurant B: $6,300 over three hours = $35 per seat per hour
Restaurant A made more money. Restaurant B ran a more efficient operation.
Without RevPASH, you’d look at the revenue and draw the completely wrong conclusion.
RevPASH measures how hard your physical space is working for you. It breaks down by hour, which means you can see exactly which time slots are performing and which are sitting underused.
Track this to:
- Identifies which hours of the day are generating revenue and which are dragging it down
- Helps you decide where to focus promotions, happy hours, or special offers
- Gives a fair way to compare revenue performance across locations of different sizes
- Supports smarter decisions around reservations, walk-ins, and service pacing
AI restaurant analytics tools that track RevPASH by hour turn a vague feeling into a specific, actionable insight.
Also Read: How AI Helps In Boosting Restaurant Revenue and Profits
4. Break-Even Point
Break-Even Point tells you exactly how much revenue you need to generate every single day, week, or month before you make a single dollar of actual profit. Everything below that number means you’re losing money. Everything above it is where your business actually starts working for you.
For example, a restaurant with $25,000 in monthly fixed costs, rent, utilities, insurance, salaries and a gross profit margin of 65% has a break-even point of $38,460 a month. That’s $1,282 every single day the doors are open. Miss that consistently and it doesn’t matter how full the dining room looks, the business is bleeding.
Track this to:
- Know exactly how much revenue your restaurant needs every day just to keep the doors open profitably
- Measure the real impact of slow seasons, quiet days, and unexpected cost increases in concrete numbers
- Evaluate every new business decision, promotions, menu changes, extended hours against a clear financial baseline
- Spot early when a location or concept is structurally viable before losses compound beyond recovery.
5. Table Turnover Rate
Table turnover rate measures how many times a table is used during a single service. Casual dining targets two to three turns. Fine dining runs at one by design. The goal isn’t to rush guests out. It’s to understand your natural rhythm and spot when something is slowing it down.
A 60-seat restaurant turning tables twice a night serves 120 covers. The same restaurant turning tables three times serves 180.
Same space. Same team. Same rent. 60 extra covers, purely from running more efficiently.
And, if the table turnover rate reduces from 2.5 to 1.8, then you need to identify the gaps.
- Is the kitchen taking too long?
- Is the team not bringing bills promptly?
- Are guests waiting too long between courses?
- Your turnover data points you toward the right questions.
Why it matters:
- More turns means more covers and more revenue without adding a single extra seat
- Highlights where your service flow is breaking down, whether in the kitchen or on the floor
- Helps you set realistic cover targets for each service
- Gives important context to your RevPASH numbers
Also Read: Optimize Table Turnover Using Analytics
6. Average Order Value (AOV)
Average order value is the average amount each customer spends per visit. Divide your total revenue by the number of transactions and you have it. Increasing your average order value has a considerable impact on your total revenue without any increase in customers, marketing, etc.
For example, if you serve 150 covers a night with an AOV of $30, that’s $4,500 in revenue. Push that AOV to $36 through with better upselling, cross-selling, a well-designed menu, and well-timed dessert recommendation, then you’re at $5,400. Same number of guests. Same staff. Same kitchen. $900 more in revenue per service, purely from being more intentional about what guests order.
Why it matters:
- Shows whether your team is upselling or leaving money on the table every service
- Measures the direct impact of menu changes, promotions, or staff training on spend per head
- Identifies which services or dayparts consistently underperform on spend
- Grows your revenue without needing more customers or more marketing spend
AI customer analytics tools can break your AOV down by server, by time of day, by day of week, so you can see exactly where the gaps are and act on them.
Also Read: How Restaurant Data Analytics Helps to Increase Profit Margin
7. Customer Retention Rate
Acquiring a new restaurant customer costs five times more than keeping an existing one. Customer retention rate tells you what percentage of your guests are returning visitors versus first-timers.
A restaurant that’s always full but mostly with new faces is working extremely hard just to stay in place. Every week is starting from zero. But a restaurant where a solid portion of covers are returning guests has a loyal base that doesn’t need to be convinced to come back. That loyalty is what carries you through a slow month, a bad review, or a new competitor opening nearby.
Why it matters:
- Tells you whether your guest experience is strong enough to actually bring people back
- Helps you spot guests who are drifting away before they’re gone for good
- Makes your marketing smarter, retaining a guest is cheaper than finding a new one
- Shows the real long-term value of your customer base, not just one-visit revenue
Modern AI customer analytics tools connect your reservation history, loyalty data, and POS records to show you exactly who’s coming back and how often.
Also Read: How AI Revolutionizes Customer Experience in Restaurant Industry
8. Gross Profit Margin
Gross profit margin measures what’s left from your revenue after you subtract the cost of the food and drinks you sold. It’s not your final profit — rent, utilities, and other overheads come out after — but it tells you clearly how efficiently your kitchen is turning ingredients into revenue.
A healthy gross profit margin means your purchasing is tight, your portions are controlled, and your menu is priced right. A weak one means money is leaking somewhere between the supplier and the plate — and usually in more than one place.
Data analytics in restaurants helps here by breaking this number down by menu category, location, and time period — because a healthy overall margin can hide a struggling section of your menu.
Why it matters:
- Shows the real impact of any menu price change, supplier negotiation, or portion tweak
- Helps you identify which parts of your menu are carrying your margin and which aren’t
- Separates kitchen efficiency issues from wider cost problems
- Gives investors or lenders a clean view of your business health
Also Read: Restaurant Profit Margin Analytics Tool to Boost Profits
9. Menu Item Profitability
Your best-selling dish might be your worst financial decision.
For example, a dish moves 80 covers a night. Staff love recommending it. Guests keep ordering it. And it’s running at a 22% margin while the rest of the menu sits at 65%. That dish isn’t a star, it’s a crowd favourite quietly costing you money at scale. Without this data, you’d keep pushing it and keep wondering why strong covers aren’t producing stronger margins.
| Category | Sales | Margin | What To Do |
| ⭐ Stars | High | High | Protect and promote these |
| 🐴 Plowhorses | High | Low | Fix the price or the portion |
| 🧩 Puzzles | Low | High | Better placement, better description |
| 🐕 Dogs | Low | Low | Remove them, no loyalty owed |
Why it matters:
- Shows exactly which dishes are building your margin and which are quietly eating into it
- Gives your menu decisions a real data foundation instead of gut feel
- Helps your front-of-house team know which items to guide guests toward
- Reveals how menu performance changes across seasons, services, or locations
Restaurant analytics and reporting platforms can now generate this analysis automatically from your sales data, updated in real time.
Also Read: Optimizing Restaurant Menu With AI Powered Data Analytics
10. Inventory Turnover Rate
Inventory turnover rate measures how quickly your stock moves, how efficiently you buy, use, and restock. A high rate means you’re buying what you need, using it, and restocking efficiently. A low rate means ingredients are sitting longer than they should, leading to waste, spoilage, and money thrown in the bin.
Low turnover hits you twice: food gets wasted, and cash gets locked in stock sitting in a cool room instead of working for your business. Restaurants lose an estimated $162 billion annually due to food waste.
A restaurant over-ordering on just five key ingredients by $500 a week is wasting $26,000 a year. Not through one dramatic mistake. Through a purchasing habit that was never questioned because no one was tracking whether the stock was actually moving.
Why it matters:
- Reduces food waste, which directly improves your food cost percentage
- Catches over-purchasing patterns before they become a regular write-off
- Helps you align your ordering with actual usage, not habit or supplier pressure
- Flags ingredients that are consistently overstocked, often a sign a dish isn’t selling as well as you think
Also Read: Optimizing Table Turnover Using Analytics
11. Employee Turnover Rate
Employee turnover rate measures how frequently staff leave your restaurant over a given period. The restaurant industry loses staff at a higher rate than almost any other. And every time someone leaves, it costs you, recruiting, training, the dip in service while a new hire finds their feet. The real cost of replacing one hourly employee can run anywhere from $1,500 to $5,000 when everything is counted.
Beyond the financial cost, a constantly changing team means inconsistent service, more pressure on experienced staff, and a guest experience that quietly degrades.
If turnover is high in a specific role or at a specific location, that pattern is telling you something. A management issue, a scheduling problem, a culture gap. The data surfaces even when conversations don’t.
Why it matters:
- Puts a real number on the cost of staff churn, making investment in retention easier to justify
- Identifies which roles or locations have disproportionately high turnover
- Connects team stability to guest experience and service consistency
- Gives multi-location owners a benchmark to compare team health across sites
Also Read: How Data Analytics Improve the Employee Performance
12. Guest Satisfaction Score
Every metric above measures something happening inside your restaurant. Guest satisfaction score measures how all of it lands on the outside, from the perspective of the person you’re doing it all for.
And it matters more financially than most owners realise. A dip in satisfaction scores in week three of a new menu launch. A specific location underperforming on food quality ratings. A spike in service complaints that lines up exactly with a change in your floor team. These are operational problems wearing a guest experience mask and this metric unmasks them.
Why it matters:
- Connects your operational performance to how guests actually experience it
- Catches recurring service or quality issues before they start affecting your revenue
- Gives your team a clear goal beyond covers and sales, one that directly influences both
- Shows whether changes you’re making are actually landing well with the people walking through your door
AI customer analytics tools are especially useful here, they process feedback across platforms and locations and surface the patterns that actually matter, so you’re not just reading reviews one by one.
Also Read: Business Intelligence For Restaurants
13. Occupancy Cost Ratio
Occupancy cost ratio measures what percentage of your total revenue goes toward occupancy expenses, rent, rates, utilities, and insurance. The healthy benchmark for most restaurants is under 10%–15% of revenue.
For example, a restaurant paying $8,000 a month in rent needs to generate at least $53,000–$80,000 in monthly revenue just to keep occupancy within a healthy ratio. If that location is consistently producing $40,000, the rent isn’t just expensive. It’s the single biggest threat to the business, and no menu change or marketing campaign fixes it.
Track this to:
- Evaluate new leases and locations with a clear financial benchmark before signing anything
- Identify which locations in a multi-site operation are structurally underperforming, beyond just revenue numbers
- Make expansion decisions based on viable unit economics, not optimism about future performance
Operators expanding too quickly often find out too late that a new location’s rent-to-revenue ratio was never viable and by then the losses from that site are pulling down everything else.
Also Read: Cost Effective AI Solution for Restaurants
3 Restaurants. 3 Success Stories with Restaurant Performance Metrics Tracking Done Right!
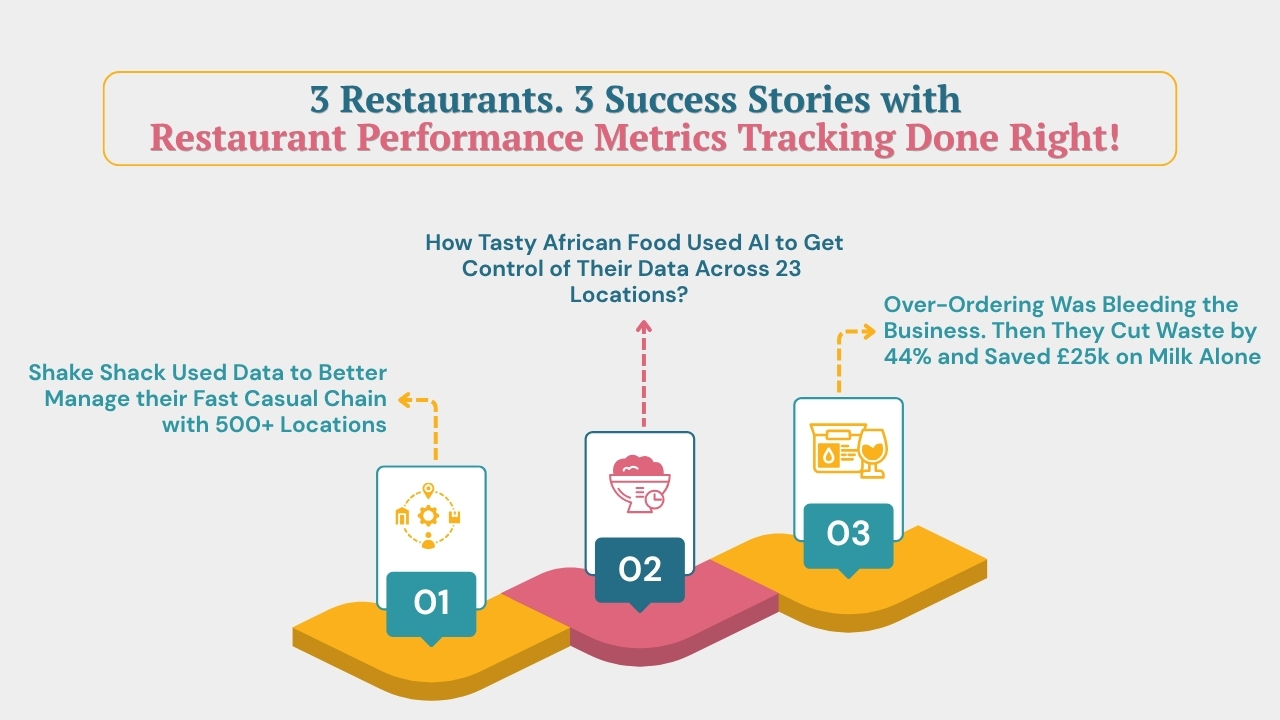
1. Shake Shack Used Data to Better Manage their Fast Casual Chain with 500+ Locations
Shake Shack is the leading US-based fast casual chain with 500+ locations across America. The CFO Katie Fogertey joined Shake Shack in 2021, the business was in a difficult place. Restaurant margins had dropped to around 17%, down from 26%–28% pre-Covid. The company was losing money and burning cash.
It was happening because they were making decisions without reliable data. No data on labor relation with the data, no data on underperforming location, no clear system for managers to understand their location and compare.
Fogertey’s first move was to build a dedicated data analytics team and make data accessible to every level of the business, not just the boardroom. Operational scorecards were introduced so managers had the key performance indicators they needed to run their locations effectively.
The Results:
- Labour costs reduced by 0.8 percentage points with the average restaurant cutting labour by 50 hours per week compared to the previous year
- Shack-level operating profit margin expanded by 240 basis points year-over-year
- Adjusted EBITDA grew by more than 60% versus the prior year
- Cost of goods reduced by 1% because of waste reduction and smarter purchasing
Fogertey summarised the impact simply: “We’re now able to understand the business at a cellular level, everything we can do to improve the company”.
2. How Tasty African Food Used AI to Get Control of Their Data Across 23 Locations?
Tasty African Food is the largest West African food chain in the UK with 23 branches across southeast England. But, they had no industry playbook to follow. They struggled with inconsistent inventory management across locations, limited real-time visibility into performance data, and no reliable way to share accurate reports with senior stakeholders across the business.
They implemented an AI restaurant analytics and reporting platform that centralised inventory, forecasting, and performance data across all 23 locations, giving every level of the business access to the same accurate, real-time picture.
Now,
- Sales forecasts now accurate to within 1.5% of actual sales
- Food waste reduced by 75% through tighter cost controls and real-time monitoring
- Full visibility into monthly waste, ordering accuracy, and platform usage.
AI is probably the most important tool you need today to stay ahead. With the way things are moving, if you aren’t using AI properly in your business, you would probably struggle to compete.” — Seun Olaimeji, Head of IT and Business Analysis, Tasty African Food
3. Over-Ordering Was Bleeding the Business. Then They Cut Waste by 44% and Saved £25k on Milk Alone
Bubble CiTea, fast-growing UK bubble tea franchise with multiple locations
They were growing fastest but also over-ordering across locations. Without real-time inventory visibility, individual venues were heading to supermarkets to buy ingredients independently. Waste was sitting at 3.2% and the business had no clear way to identify where the problem was coming from.
Then, they switched to a centralized restaurant analytics and reporting platform with demand-based ordering. Every location started ordering based on actual sales data, not habit or assumption. Variance alerts flagged overspend in real time, allowing the team to correct issues within days rather than discovering them at month end.
The Results:
- Food waste was reduced by 44%. from 3.2% down to 1.8%
- Saved £25,000 per year on milk alone through smarter purchasing insights
- Central production unit eliminated over-ordering entirely across all locations
“With AI restaurant analytics tools, we quickly spotted inefficiencies in how we manage stock. We noticed that certain stores over-order and waste a lot of ingredients and we put things right.” — Mateusz Kapciak, Head of Operations, Bubble CiTea
Tracking Restaurant Performance Metrics Doesn’t Have to Be Complicated. Here’s How To Do It Without the Chaos!
If you’ve made it through all 12 metrics, one thought has probably crossed your mind, this is a lot to stay on top of while actually running a restaurant.
And you’re right. Manually tracking 12 metrics across kitchen operations, customer behaviour, inventory, and marketing while managing staff, serving guests, and making decisions on the fly, isn’t realistic. Something always slips.
This is where Livelytics comes in.
Livelytics is an AI powered restaurant business intelligence tool that automatically collects, tracks, and manages all of this data in one place, so you always have a clear, real-time picture of how your restaurant is performing without chasing numbers across different systems.
It covers all the restaurant analytics And reporting, that we’ve talked about in this blog:
- Operational metrics — prime cost, labour, table turns, RevPASH
- Inventory metrics — stock movement, waste, purchasing patterns
- Customer metrics — retention, satisfaction, spending behaviour
- Marketing metrics — what’s driving revenue and what isn’t
Beyond tracking, Livelytics also provides ML powered recommendations, so it doesn’t just show you what’s happening, it tells you what to do about it.
And when you need a quick answer without digging through reports, Livelytics’ built-in AI assistant, Liv AI, gives you instant clarity on any aspect of your restaurant’s performance. Just ask, and you have your answer.
Also, this restaurant business intelligence tool seamlessly integrates and centralises your operations so your team works smarter, not harder.
To see how it works inside a real restaurant operation, book a free Livelytics demo today.
Also Read: How Data Analytics Helps Restaurant Grow
The Difference Is in the Details
Running a great restaurant has always been about more than great food.
The 12 restaurant performance metrics in this blog won’t run your restaurant for you. But they will give you something every owner deserves, clarity of what’s working, what isn’t. The kind that replaces end-of-month surprises with early decisions. The kind that turns a busy week into a genuinely profitable one.
You don’t need to track all 12 overnight. Start with the ones that feel most relevant, build the habit. Let the numbers guide you.
And, with the right restaurant analytics and reporting system in place, you can get started and do it with ease.
And when you’re ready to bring all of it together in one place without the spreadsheets, without the manual work, Livelytics is there when you need it. A simple, powerful AI restaurant analytics tool built for the way restaurants actually run.
Curious about how Livelytics works inside a real restaurant operation? Book a free Livelytics demo today.