Traditional methods of managing restaurants and their data sucks.
The industry standard is to review financials 15-30 days after month-end. By the time you see that your food cost spiked to 36% in March, you’ve already bled through April. By the time you realize labor efficiency dropped in your dinner shifts, you’ve overstaffed for six weeks straight.
This delayed feedback loop is killing margins.
The operational gap between high-performing restaurants and struggling ones isn’t quality, location, or concept strength. It’s visibility. Top-performing operators know their numbers very well. They spot variance in recipe yields within 48 hours. They identify underperforming menu items before those items cost them a quarter’s worth of margin.
The rest are managing restaurants like it’s still 1995.
The solution isn’t more data. It’s the right data, measured correctly, reviewed at the right frequency.
This isn’t analytics theory. It’s the measurement infrastructure that separates restaurants with consistent 8-12% net margins from those perpetually hovering at breakeven.
Also Read: Restaurant Profit Margin Analytics Tool to Boost Profits
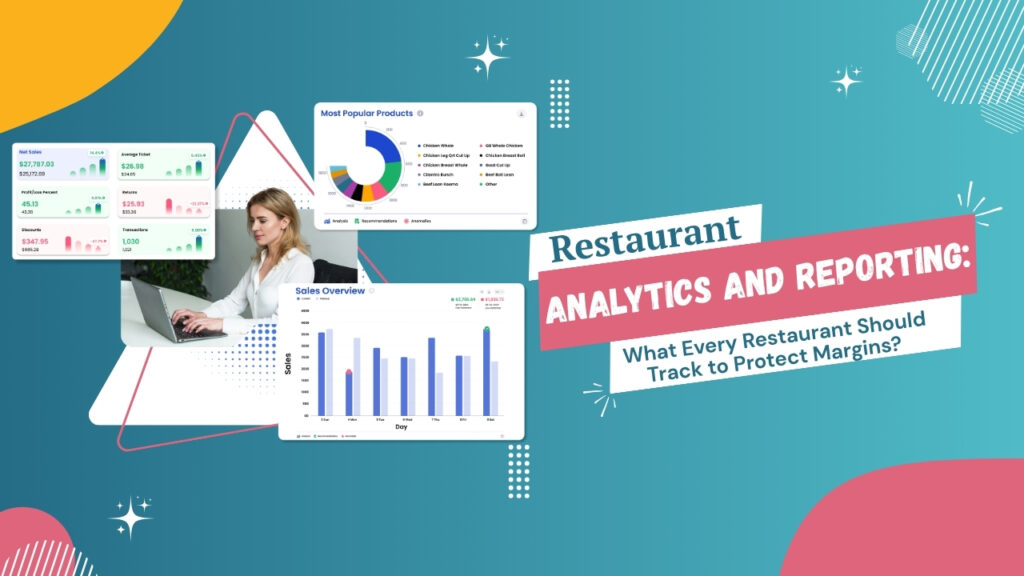
What is Restaurant Analytics and Reporting?
Restaurant Analytics and Reporting is the process of tracking specific operational and financial metrics across your restaurant, then using that data to identify problems and make decisions.
It measures what’s happening in real-time, food costs, labor efficiency, sales patterns, waste, and vendor pricing instead of waiting for end-of-month financials to tell you what already happened.
For example,
A restaurant notices its monthly P&L shows food cost jumped from 29% to 34%. That’s a $6,500 problem for a restaurant doing $130,000 in monthly sales. But the monthly report doesn’t explain why.
With restaurant analytics, the owner drills into the data and finds:
- Chicken breast orders increased 40% over three weeks
- Sales of chicken dishes only increased 12%
- The difference: 28% waste, primarily from over-prepping for a lunch special that underperformed
- The kitchen was prepping 60 portions daily, selling 35, and discarding the rest after two days
The analytics system flagged this within five days by comparing theoretical usage (based on sales) against actual usage (based on inventory). The owner discontinued the lunch special, adjusted prep quantities, and food cost returned to 29% the following week.
Without analytics, this would have appeared as a single line item, food cost: 34%”, discovered 30 days later, with no clear cause and another month of waste already baked in.
Also Read: A Complete Guide to Restaurant Business Analytics
Restaurant Analytics and Reporting
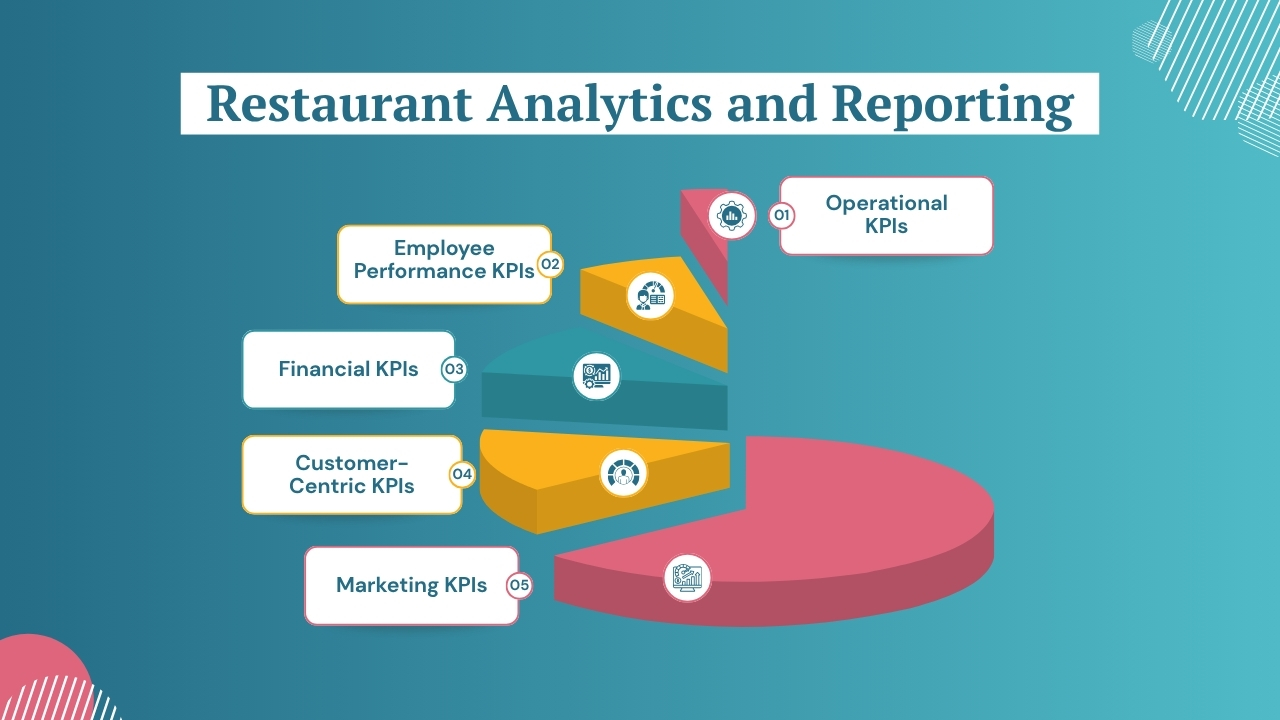
A. Operational KPIs
Most operators think operational problems show up in the P&L. They don’t, not until it’s too late. By the time your food cost is sitting at 34% on a monthly report, you’ve already lost three weeks of margin. Operational KPIs in restaurant analytics are what give you visibility while things are still happening, not after.
1. Table Turn Time
Table turn time measures how long customers stay from seating to when the table is ready again. It controls how many guests you can serve with your existing seats. If your 100-seat restaurant turns tables 2.5 times during dinner instead of 3 times, you’re losing 20 covers per night, roughly $20,000 each month.
Benchmark: 45-60 minutes for casual dining, 90-120 minutes for fine dining.
Going over consistently means your kitchen is slow, servers are backed up, or payments are taking too long.
Also Read: Optimizing Table-Turnover Using Analytics
2. Kitchen Ticket Time
Kitchen ticket time tracks how long it takes from when an order hits the system to when food is ready. It affects everything, table turns, customer satisfaction, and how many covers you can handle during peak hours.
Benchmark: Appetizers should be out in under 8 minutes, entrees in 12-18 minutes.
If certain items consistently run over 20 minutes, you have recipe problems, equipment bottlenecks, or staffing gaps. Track by station to find exactly where your kitchen workflow slows down.
Also Read: How Restaurant Business Intelligence Helps Owners Make Fast Decisions
3. Inventory Turnover Ratio
Inventory turnover shows how often you cycle through your stock. It tells you if you’re over-ordering and tying up cash in products sitting in your walk-in. Calculate it as your cost of goods sold divided by the average inventory value.
Benchmark: 4-8 times monthly for perishables, 1-2 times for dry goods.
Low turnover means money stuck in stock and a higher spoilage risk. High turnover might mean you’re running out of items too often.
Also Read: AI For Restaurant Inventory
4. Theoretical vs. Actual Food Cost Variance
This measures the gap between what your food costs should be based on sales and recipes, versus what you actually spent based on inventory.
Benchmark: The gap should be 1-2%.
Anything over 3% means you have portion control issues, waste, theft, or vendor pricing changes you haven’t caught. A 3% gap on $2M in sales costs you $60,000 yearly.
Also Read: How to Calculate Food Cost Percentage
5. Spoilage and Waste Rate
Spoilage and waste rate tracks the value of food you throw away as a percentage of what you buy. This includes expired products, over-prepped items, trim waste, and quality rejections.
Benchmark: Industry average runs 4-10% of food cost, but you should target under 6%.
On $2M in revenue, cutting waste from 8% to 5% puts $36,000 back in your pocket. Track daily by category and take steps accordingly.
Also Read: The Role of Data Analytics for Reducing Restaurant Waste
6. Vendor Price Variance
Vendor price variance catches when suppliers raise prices without you noticing. Compare current invoice prices against what you paid last month or your contracted rates. Review weekly, line by line, not just the invoice total.
Benchmark: 2-3% monthly for market-driven items (produce, seafood), under 1% for contracted proteins and dry goods, and total annual price drift under 5-7%.
A 5% increase in chicken, which represents 20% of your purchases, raises your overall food cost. That costs a $2M restaurant $20,000 annually. Catch it early, and you can renegotiate or find another supplier.
Here’s the Employee Performance KPIs section with keywords bolded:
B. Employee Performance KPIs
Employee performance metrics track workforce productivity, efficiency, and retention across all positions. These restaurant performance metrics help you optimize labor costs, reduce turnover expenses, and identify where training improves service quality and operational consistency.
1. Labor Cost Percentage
Labor cost percentage measures total labor expense (wages, taxes, benefits) as a percentage of revenue.
Benchmark: 25-30% for quick service, 30-35% for casual dining, 35-40% for fine dining.
A restaurant running 38% labor versus 33% target on $2M revenue loses $100,000 annually to overstaffing. Track by daypart to catch overstaffed shifts that weekly averages hide; your Tuesday lunch might be bleeding money while Saturday dinner looks fine.
Also Read: How Data Analytics Improves the Measurement of Employee Performance
2. Server Productivity Metrics
Server productivity tracks individual performance across average check size, table count, upsell rate, and sales per shift. Top-performing servers generate 15-25% higher checks through effective suggestive selling.
If your best servers average $62 checks while others average $48, that $14 gap across 25 tables equals $350 daily, $127,000 annually per position. This restaurant data analytics helps you schedule top performers during peak shifts and identify who needs sales training.
Also Read: How AI Unlocks Business Insights That Drive Required Results
3. Labor Efficiency Variance
Labor efficiency variance shows the gap between how many staff you scheduled versus how many you actually needed based on customer count. If you schedule 12 people expecting 180 customers but only 140 show up, you’re paying for 3-4 unnecessary labor hours, around $150 wasted per shift, which is huge when considered for a week.
Track this by daypart because your weekly numbers might look okay while lunch is overstaffed and dinner is short-handed. Data analytics in restaurants catches these patterns so you can schedule based on real traffic, not estimates.
Also Read: How Restaurants Can Use BI Dashboards to Track Sales Labor and Inventory
4. Employee Turnover Rate
Employee turnover rate measures how many employees leave as a percentage of your total staff. Calculate it by dividing departures by your average headcount, then multiplying by 100.
Benchmark: Industry average is 70-75% yearly, but well-run restaurants keep it around 40-50%.
Each person who leaves costs you $5,864 in hiring and training costs. A 50-person team with 75% turnover spends $219,900 on replacements yearly versus $146,600 at 50% turnover, that’s $73,300 in savings. Break it down by front-of-house versus back-of-house and by how long people stayed to see if you have a hiring problem or a management problem.
Also Read: Key Metrics Every Restaurant Owner Should Be Tracking
C. Financial KPIs
Financial KPIs measure revenue performance, profitability, and cash flow beyond monthly P&L statements. These restaurant analytics and reporting metrics provide real-time visibility into margins, pricing effectiveness, and fiscal health so you can manage money proactively instead of reactively.
1. Prime Cost
Prime cost combines your two biggest expenses, food cost plus labor cost, as a percentage of revenue. It’s the single most critical profitability metric because it represents 60-70% of your total costs. Calculate as (Cost of Goods Sold + Total Labor) divided by revenue, times 100.
Target range: 55-65% for profitable operations; anything over 70% means serious margin trouble.
A restaurant at 68% prime cost has only 32% left for rent, utilities, and profit. At 62%, that margin jumps to 38%, the 6-point difference on $2M revenue is $120,000 in profit capacity.
Also Read: Cost Effective AI Solutions for Restaurants
2. Net Profit Margin
Net profit margin is what remains as actual profit after all expenses. Calculate as net income divided by revenue times 100.
Industry benchmark: 3-9% for healthy restaurants; 10%+ is exceptional. Full-service average: 4-6%; limited-service: 6-9%.
A restaurant doing $2M at 8% nets $160,000. At 4%, profit drops to $80,000, half the return for identical revenue. Margins below 3% signal unsustainable costs or pricing problems requiring immediate correction.
3. Revenue per Available Seat Hour (RevPASH)
RevPASH measures how much revenue each seat generates per hour you’re open. Calculate as total revenue divided by (number of seats times operating hours). Low RevPASH means underutilized capacity, slow turns, or low check averages.
Benchmarks: casual dining $8-$12, fine dining $15-$25, quick service $4-$7.
A 100-seat restaurant open 12 hours creates 1,200 seat-hours daily. At $12 RevPASH, that’s $14,400 revenue. At $9 RevPASH, only $10,800, you’re losing $3,600 daily or $1.3M yearly from the same space. Track by daypart to find weak periods worth fixing.
Also Read: How AI Helps in Boosting Restaurant Revenue and Profits
4. Average Check Size
Average check size tracks mean spending per customer, including food, beverage, and add-ons. Calculate as total revenue divided by cover count. A restaurant serving 500 weekly covers at $42 average generates $21,000 versus $25,000 at $50 average, a $208,000 annual difference with identical traffic.
Track by daypart (breakfast typically 50-60% of lunch, lunch 60-70% of dinner) and by server. Declining averages mean guests are trading down, or servers aren’t upselling effectively.
5. Cash Flow and Working Capital
Cash flow tracks actual cash moving in and out, while working capital is your current assets minus current liabilities, the money available to operate. You can be profitable on paper but run out of cash if customers pay slowly, inventory sits too long, or you pay vendors faster than you collect.
Benchmark: Positive working capital (1.5-2× your liabilities) keeps operations stable.
AI restaurant reporting platforms track this in real-time to prevent cash shortfalls.
6. Break-Even Point
The break-even point is the minimum revenue needed to cover all costs without profit or loss. Calculate as fixed costs divided by (1 minus variable cost percentage). If you have $45,000 in monthly fixed costs and 65% variable costs, your break-even point is $128,571 monthly or $4,285 daily.
Revenue below break-even burns cash. Above it, you make a profit. Understanding break-even helps you decide: close that day, run limited hours, or build promotions to hit minimum viable revenue. Recalculate whenever fixed costs change from rent increases, equipment leases, or new salaried staff.
D. Customer-Centric KPIs
Customer-centric metrics measure satisfaction, loyalty, and repeat behavior. These restaurant performance metrics show how your service quality and food consistency impact retention and long-term profitability.
1. Customer Retention Rate
Customer retention rate tracks how many customers come back within a set timeframe, usually 30, 60, or 90 days. Calculate it by dividing repeat customers by total unique customers, then multiplying by 100.
Benchmark: 25-35% return within 30 days for casual dining, 40-50% for quick service.
Low retention means you’re constantly spending on marketing to replace people who aren’t coming back, which kills profitability.
Also Read: How AI Revolutionizes Customer Experience in Restaurant Industry
2. Online Review Rating
Online review ratings across Google, Yelp, and social platforms directly impact whether new customers visit. 86% of people read reviews before trying a restaurant. You need 4.0+ stars to drive traffic; below 3.5 seriously hurts new customer acquisition.
A drop from 4.4 to 3.9 stars can cut new traffic by 15-25%. Monitor review content too; if five recent reviews mention slow service, you have an operations problem that needs fixing before more customers experience it. Restaurant business intelligence tools can track ratings and alert you to patterns.
3. Customer Acquisition Cost (CAC)
Customer acquisition cost shows how much you spend in marketing and promotions to get one new customer. Divide your total marketing spend by the number of new customers acquired.
Benchmark: $15-$35 per new customer for local restaurants.
If acquiring customers costs $40 but their first visit averages $35, you’re losing money until they return. Track by channel, so you know where to invest your budget. AI restaurant analytics platforms can track which channels deliver the lowest acquisition costs.
Also Read: A Complete Guide to Data Analytics for Restaurants
4. Customer Lifetime Value (CLV)
Customer lifetime value estimates total revenue a customer generates across all their visits. Calculate it as average check times visit frequency times how long they stay a customer. Example: $45 check × 8 yearly visits × 3 years = $1,080 lifetime value. Your CLV should be 3-5 times your acquisition cost for healthy economics. A customer worth $1,200 justifies $40 to acquire them; a customer worth $300 doesn’t. This helps you decide which customers to focus on and how much to spend getting them.
5. Table Occupancy Rate
Table occupancy rate measures the percentage of your available seats are actually being used. Calculate occupied seat-hours divided by total available seat-hours, times 100. Target: 60-75% during all operating hours, 85%+ during peak periods. Low occupancy means empty seats you could fill with better marketing or pricing. Occupancy over 90% with regular wait times means demand exceeds capacity—you might need more seats, adjusted hours, or higher prices to maximize revenue from limited space.
Also Read: How to Setup KPIs for Your Business
E. Marketing KPIs
Marketing KPIs measure campaign effectiveness and return on investment. These metrics connect your marketing spend to actual revenue, helping you allocate budgets to channels that deliver real customers, not just impressions.
1. Marketing Return on Investment (MROI)
Marketing ROI calculates revenue generated per dollar spent on marketing.
Formula: revenue from marketing minus marketing cost, divided by marketing cost, times 100.
Minimum viable return: 3:1 ($3 revenue per $1 spent); strong performance: 5:1 or higher. A campaign returning 6:1 deserves more budget; 1.5:1 is burning money. Track by channel—if Instagram ads deliver 6.5:1 while print ads deliver 1.8:1, shift budget to what’s working. AI restaurant reporting platforms can automatically calculate MROI by channel.
2. Social Media Engagement Rate
Social media engagement rate measures how your audience interacts with your content, likes, comments, shares, and saves divided by follower count, times 100.
Benchmark: 1-3% is good, 3-6% is excellent, and under 0.5% means low-quality followers.
Engagement matters more than follower count because platforms show high-engagement content to more people. Also, track which content types (food photos, behind-the-scenes, promotions) get the most engagement.
Also Read: Data Driven Social Media Strategy for Your Business
3. Local Search Visibility
Local search visibility tracks where you rank in “restaurants near me” searches and how many people click through to your website or call.
Target: top 3 positions for your cuisine plus location searches.
Monitor your Google Business Profile performance: impressions, clicks, direction requests, and phone calls. Restaurant business intelligence reveals when competitors outrank you or when optimization improves positioning.
4. Promotion Redemption Rate
Promotion redemption rate shows what percentage of distributed offers actually get used.
Benchmarks: 5-15% for digital promotions, 1-3% for physical mailers. A $5 off $25 offer sent to 2,000 email subscribers with 12% redemption (240 uses) costs $1,200 in discounts.
If those visits generate $35 average checks, that’s $8,400 revenue. Low redemption (under 3%) means unappealing offers or poor distribution. High redemption (over 20%) with few new customers means you’re just discounting existing traffic without growth. Data analytics in restaurants helps identify which offer types drive new customers versus discount regulars.
5. Influencer Campaign Performance
Influencer campaign performance tracks results from food blogger partnerships and influencer collaborations using unique codes or links. Measure reach, engagement, click-throughs, and cost per new customer acquired.
Micro-influencers (5K-50K followers) often deliver better ROI than macro influencers (100K+). An influencer with 80K followers charging $800, who generates 12 trackable visits, costs $67 per customer. A micro-influencer with 15K followers, $150 fee, generating 18 visits costs $8 per customer, much better return.
Require trackable methods to measure actual conversions, not just exposure. AI restaurant analytics platforms can consolidate influencer campaign data with overall marketing performance.
Livelytics AI for Track Restaurant Metrics, All Automated
Livelytics is an AI-powered restaurant business intelligence and data analytics platform designed for restaurant owners who need clear visibility into their operations without manual tracking and management.
It seamlessly connects with your POS system, social media channels, accounting tools, and other business tools to help you track all the crucial restaurant metrics, track the gaps and red gaps, and even guides you on decision-making.
Why Livelytics Works for Restaurant Businesses:
- Purpose-built for restaurant analytics
Tracks industry-specific metrics such as prime cost, food cost variance, labor efficiency by daypart, table turns, menu profitability, guest lifetime value and more for restaurant businesses. - Unified restaurant business visibility
Generated reports and key restaurant metrics from POS, labor, inventory, delivery, accounting, review platforms, and more into a single dashboard for a clear, complete view of restaurant performance. - Proactive Alerts & Anomaly Detection – AI continuously monitors restaurant operations to detect unusual patterns in sales, labor, inventory, or pricing and alerts operators before issues impact margins.
- AI-Powered Predictive Intelligence – Livelytics uses AI and machine learning to forecast demand, identify operational anomalies, detect ingredient cost spikes, and highlight revenue opportunities before they impact financial performance.
- Liv AI – Conversational Decision Intelligence – The built-in generative AI assistant allows operators to ask questions like “Why did labor costs spike?” or “Which stores are underperforming?” and instantly receive actionable insights and recommendations.
- Cross-Location Benchmarking & Store Scoring – Automatically compare locations across sales momentum, labor efficiency, cost control, and guest sentiment to identify top performers and operational gaps across the network
- Easy to Set Up and Use – Connect your existing POS, labor, inventory, and other systems, and the platform automatically starts collecting and analyzing your data without complex setup.
- Affordable & Scalable – Livelytics is an affordable AI data tool with a subscription model. It means you don’t have to break the bank and can easily scale up and down as pee your business needs.
If you’re looking to see how Livelytics works across your business and want to experience real-time insights in action, book a free Livelytics demo today.
Final Thoughts
Restaurant performance rarely improves through big changes alone. More often, it improves when operators start paying closer attention to the small signals happening every day, cost fluctuations, operational gaps, and customer behavior patterns that quietly shape profitability.
The more clearly you can see these signals, the easier it becomes to make timely decisions that keep operations efficient and margins healthy.
Today, many restaurants are moving toward tools that make this visibility easier and more consistent.
If you’re exploring ways to track these metrics without relying on delayed reports or manual analysis, check out Livelytics, our powerful, AI data platform made for restaurant businesses. Book a free demo today and see how it works in a real business environment, and decide.