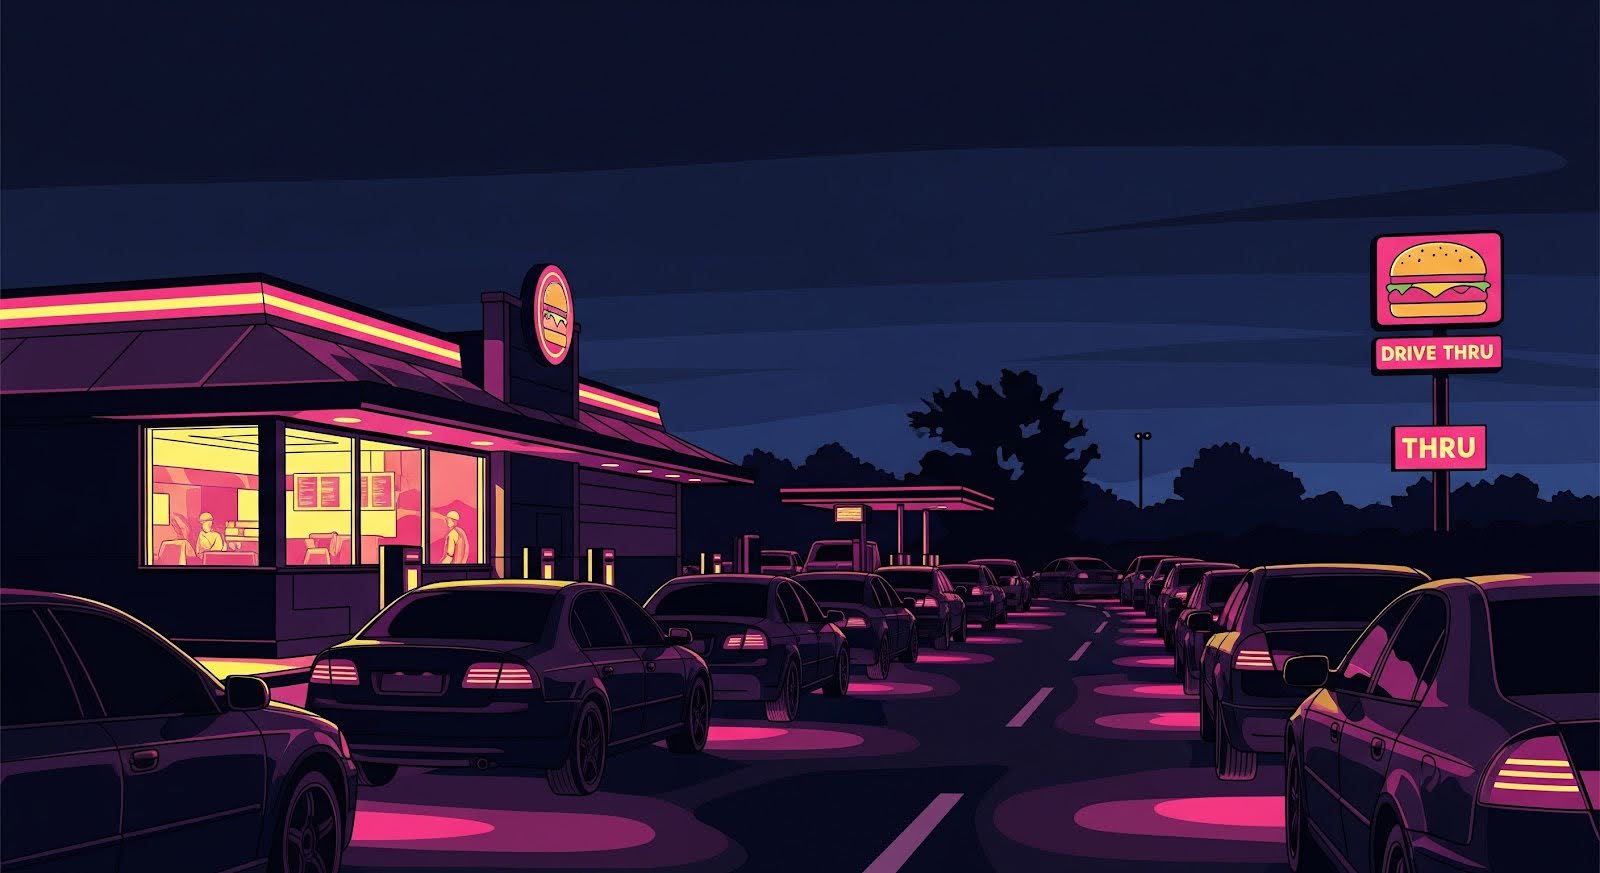
For enterprise QSR burger brands, the drive-thru is not just a channel.
It is the business.
A few seconds lost per order compound into longer lines, frustrated guests, stressed teams, and millions in unrealized revenue across hundreds or thousands of locations. Yet one of the most common questions operations leaders ask remains frustratingly difficult to answer:
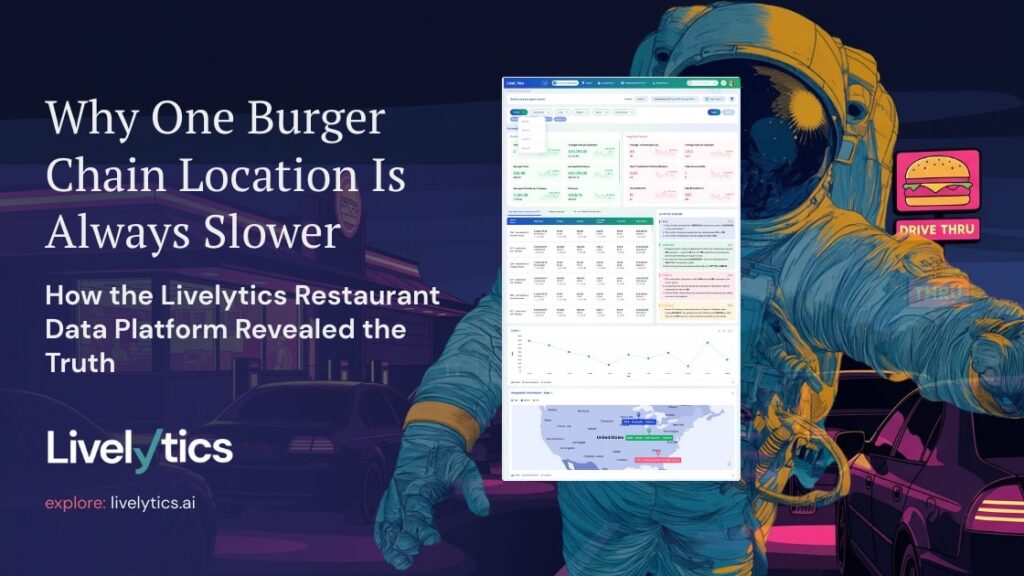
Why does one store consistently run slower than the rest, even when everything looks the same on paper?
- Same menu.
- Same equipment.
- Same staffing model.
- Same training playbook.
- Different results.
This is where most traditional restaurant reporting fails and where the Livelytics restaurant data platform changes the conversation entirely.
The Real-World Problem: Chronic Drive-Thru Underperformance
Consider a national QSR burger brand operating hundreds of locations.
One store, Store #214, has been running 12–14% slower drive-thru times than the regional average for months. The brand has tried all the usual fixes:
- Adjusting staffing levels
- Retraining crew members
- Reviewing KDS timing reports
- Inspecting equipment
- Coaching the GM
Nothing sticks.
From the data they can see, nothing is wrong.
But from the guest’s perspective, everything is.
This is the blind spot created by disconnected systems and surface-level metrics.
Why Traditional Drive-Thru Data Falls Short
Most brands rely on a mix of:
- POS transaction timestamps
- KDS ticket completion times
- Labor schedules
- Occasional mystery shop reports
Each tool tells part of the story. None explain why performance breaks down.
They don’t account for:
- Prep timing drift
- Portioning inconsistencies
- Order clustering from digital and pickup
- Station-level friction
- Micro-delays that compound during peak hours
Without unifying these signals, operators are left guessing. Livelytics was built specifically to eliminate that guesswork.
How Livelytics Sees What Others Miss
By connecting and harmonizing data across POS, KDS, labor, inventory, and digital ordering systems, Livelytics creates a true operational view of the drive-thru — not just timestamps, but behavior.
Learn more about how Livelytics unifies restaurant data on the
Livelytics Restaurant Platform:
Once Store #214’s data is ingested and analyzed, the real story emerges:
- Prep cycles for core ingredients are drifting 10–12 minutes off standard
- Over-portioning on signature burgers is slowing grill throughput
- One fry station consistently lags between 11:30 a.m. and 1:30 p.m.
- Digital pickup orders spike on Fridays, silently choking the line
- Labor coverage looks correct on paper, but is misaligned by position
None of these issues appear in isolation as “critical.”
Together, they explain everything.
From Insight to Action: Operational Intelligence That Prescribes, Not Just Reports
What makes Livelytics different is not visibility alone — it’s prescription.
Instead of dumping data on operators, Livelytics surfaces clear, prioritized insights:
Drive-thru throughput at Store #214 is trending 15% below benchmark.
Primary drivers: fry station slowdown during lunch + prep timing variance.
Recommended actions: station swap, adjusted prep cadence, portioning correction.
This insight flows to:
- The GM, in time to adjust the shift
- The regional director, with context
- The enterprise ops team, for pattern recognition across locations
Explore how Livelytics supports restaurant Operations Intelligence
The Outcome: Faster Lines, Happier Guests, Stronger Margins
Within two weeks of acting on Livelytics insights:
- Drive-thru times normalize to regional benchmarks
- Guest wait times shrink
- Order accuracy improves
- Labor is reallocated more effectively
- Revenue per hour increases, without adding headcount
Most importantly, leadership now understands why performance changed — and how to replicate success elsewhere.
This is how enterprise QSR brands move from reactive firefighting to proactive operations.
Why This Matters for Every QSR Burger Brand
Drive-thru performance does not fail in obvious ways.
It erodes quietly — through small inefficiencies that stack up shift after shift.
Livelytics gives restaurant leaders:
- A single source of operational truth
- Early warning signals before guests feel pain
- Location-to-location consistency
- Data-backed coaching instead of assumptions
- A scalable blueprint for throughput excellence
Learn more about Livelytics’ AI-driven intelligence for restaurants.