Introduction
In today’s data-driven world, businesses rely and thrive on data. The more data an organization can collect and analyze, the more prepared it is to make informed decisions.
Thank you for reading this post, don't forget to subscribe!But companies are gathering more data than ever before, making it essential to find a way to understand the data accurately. Without context, data is meaningless, and organizations find it challenging to turn the increasing volume of information into insights.
Fortunately, tools have been developed to assist in transforming this huge amount of information into meaningful insights that help businesses grow and drive success within an organization – business intelligence dashboards. These are effective tools for handling and analyzing data.
It showcases your business insights and data points on a single screen so businesses can see all the information at once.
In this blog, we’ll be discussing the basics of a business intelligence dashboard, how it works, and how it helps businesses with data collection and data-backed decisions.
Also Read: Business Intelligence for Marketing
What is a Business Intelligence Dashboard?
Fundamentally, a business intelligence dashboard is an information management system. These dashboards compile all of the information and display metrics, performance scorecards, and stats on a single screen. The purpose is to provide users with a concise, easy-to-read assessment of the company’s performance.
- Businesses can view real-time interactive elements such as filters, graphs, charts, and reports with BI dashboards.
- It also makes use of cloud-based technology, which enables you to access important data from anywhere at any time.
Whether you’re a small bakery checking daily sales or a multinational organization overseeing operations across continents, there’s a dashboard just for you. The best part of these dashboards is their adaptability—they can be customized to focus on the KPIs that are most important to you, providing a glimpse of your business performance that is unique.
Also Read: How Business Intelligence is Helping Business
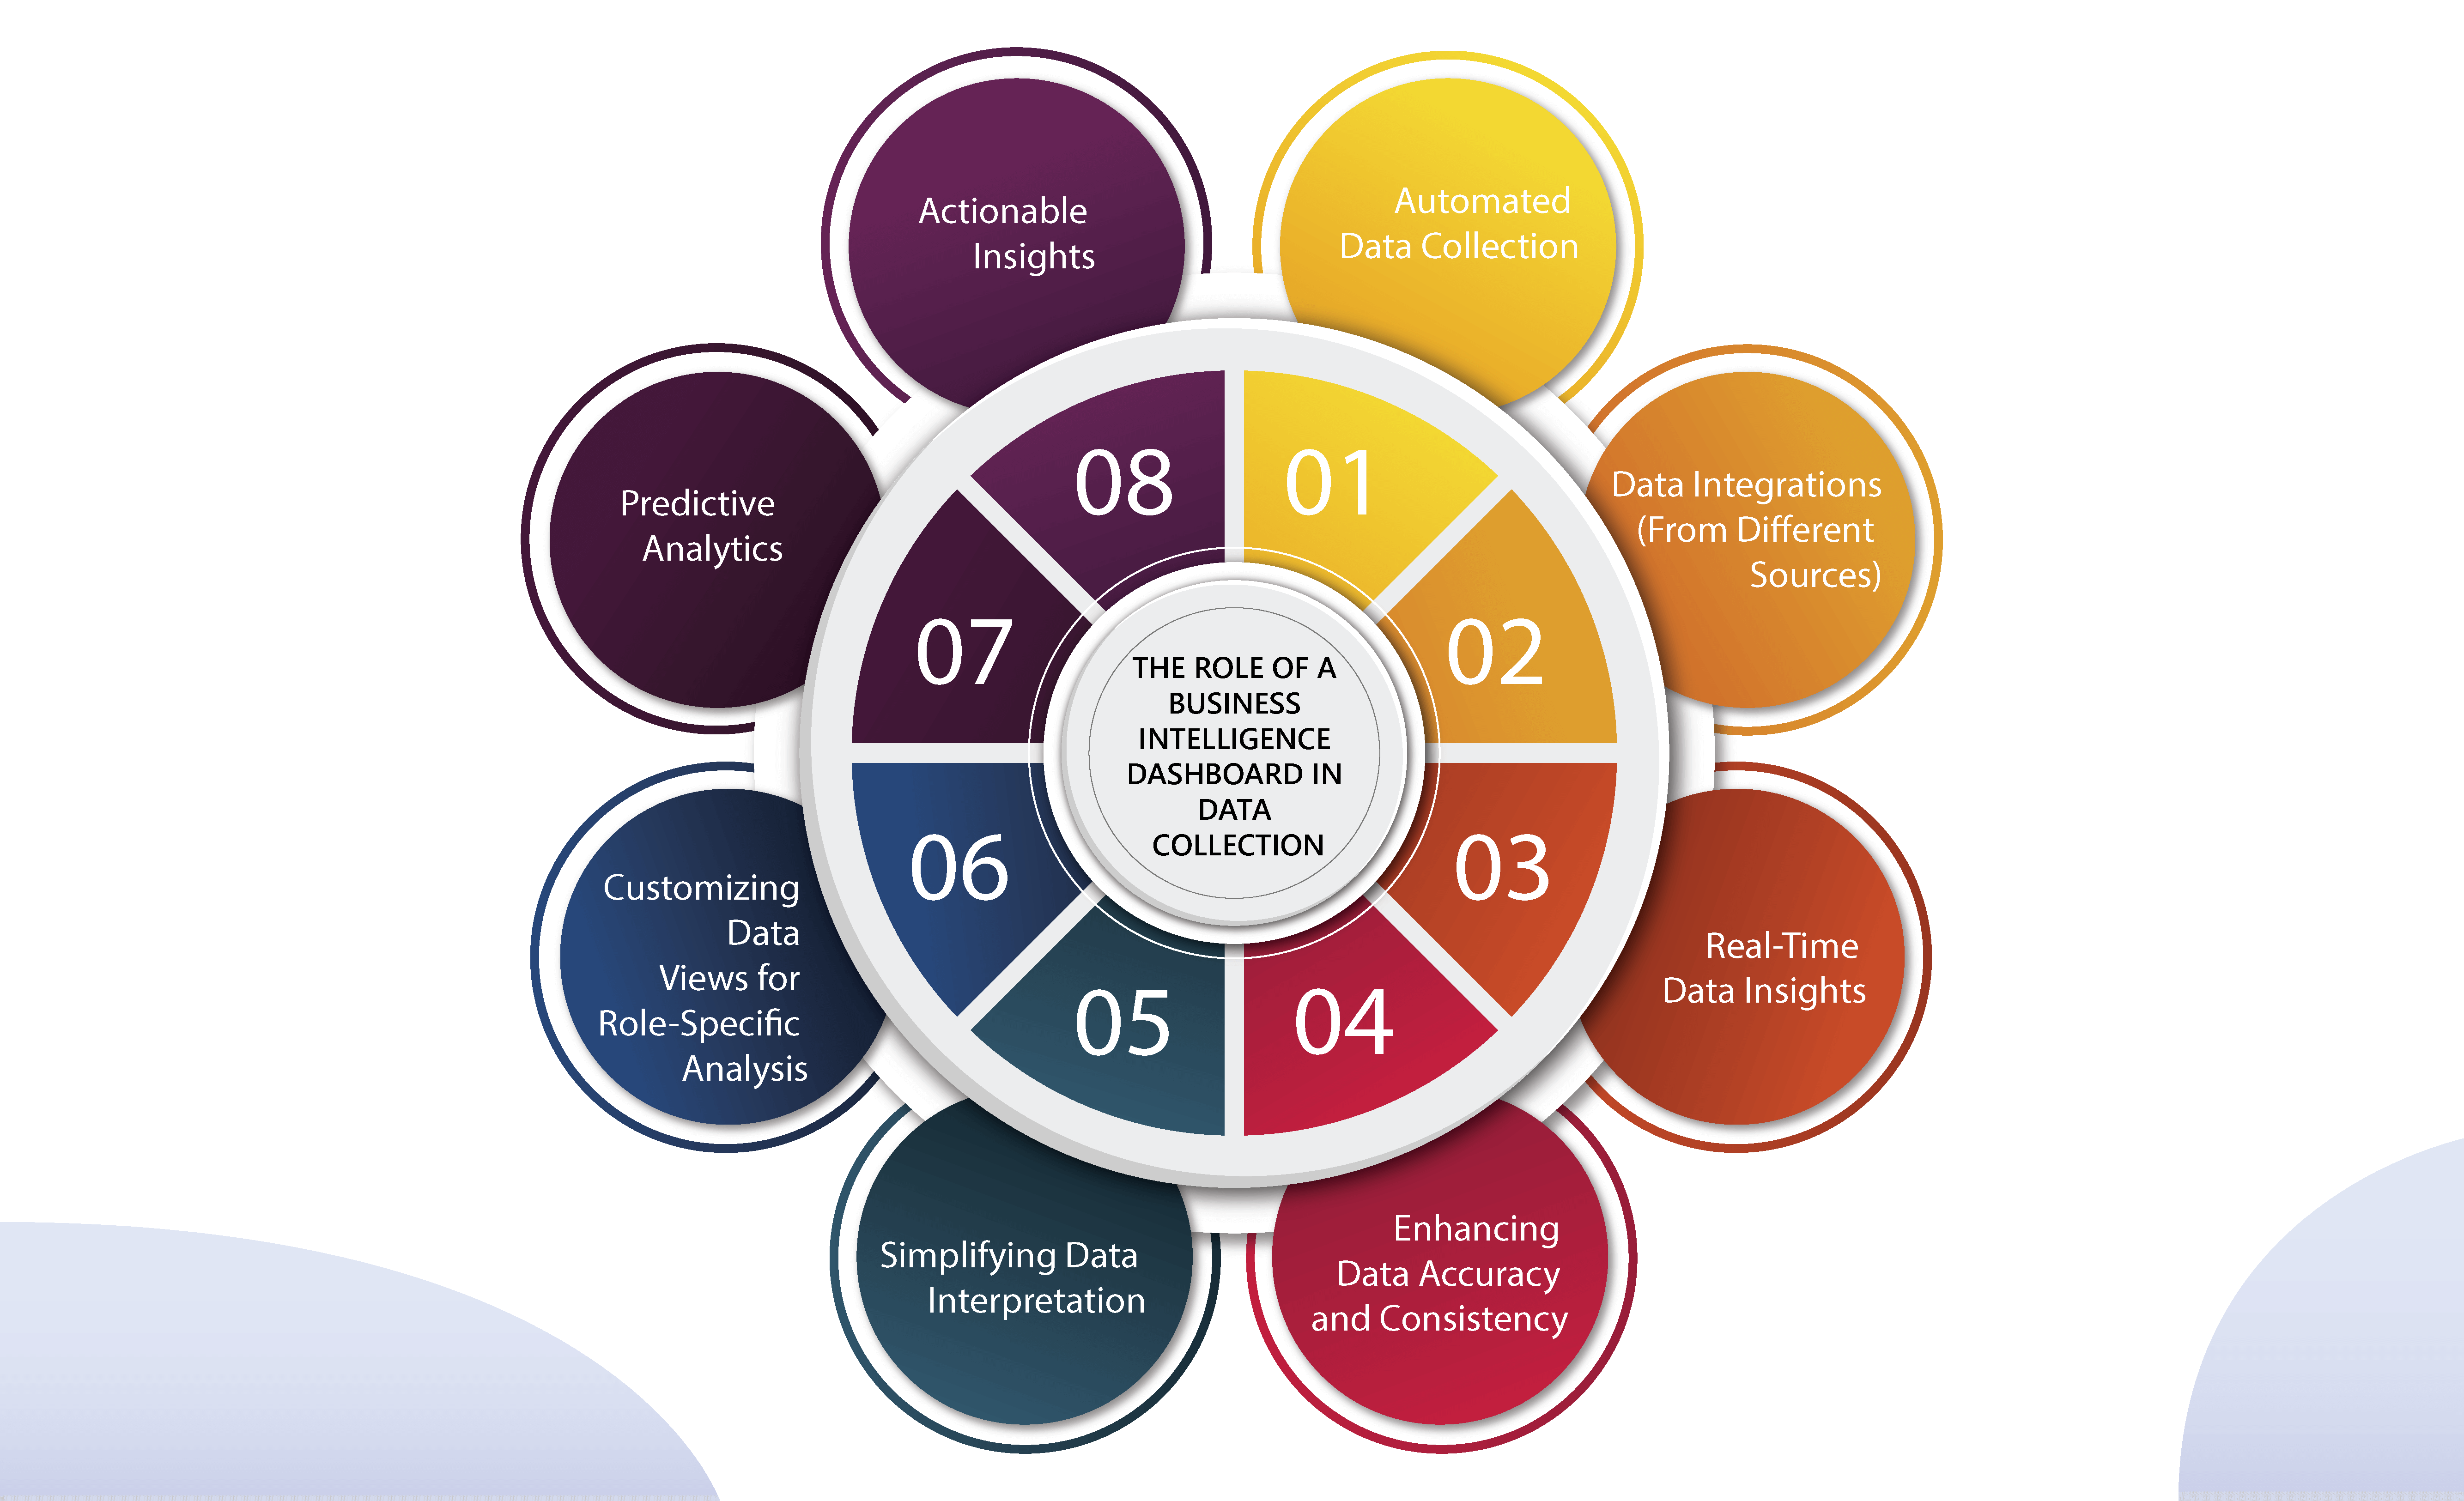
The Role of a Business Intelligence Dashboard in Data Collection
Now, let us discuss data collection. It’s similar to the first scene of a data tale, in which information from many sources is gathered to lay the groundwork for informed choices. While data collecting may be a separate process, a Business Intelligence Dashboard is critical for directing and making sense of it.
Consider your Business Intelligence Dashboard to be a control tower that gives you a birds-eye view of your data ecosystem. It assists you in determining where your data collection is successful and where it may fall short.
It also draws attention to any gaps in your data, which makes you think about other possible sources of information. It is an important component of your whole data ecosystem since it provides a full perspective of your data.
1. Automated Data Collection:
Gathering data manually—whether through spreadsheets, disconnected tools, or manual reports—is time-consuming, error-prone, and inefficient. It leads to inconsistent reporting, delays in decision-making, and increased operational workload.
BI dashboards automate this manual, error-prone, extensive process. Here’s how it works and helps.
- Automated data collection from various sources: It automates data collection from multiple sources, such as CRM systems, ERP platforms, marketing analytics tools, and financial databases.
- Real-time insights: Instead of manually pulling numbers from different reports, the dashboard continuously updates itself in real-time, which users can see on a single screen. Real-time data + easy accessibility = best decisions.
- Eliminating errors & frees up valuable time: This data collection automation ensures accuracy by eliminating human errors and frees up valuable time for leadership teams to focus on strategy rather than administrative tasks.
- Boost efficiency: It improves reporting efficiency, reduces discrepancies, and ensures that every decision is backed by reliable, up-to-date data.
For example, a mid-sized casual dining group with 12 locations used a BI dashboard to optimize peak-hour traffic, menu offerings, and inventory. By analyzing real-time sales and table turnover, they adjusted staffing and seating, cutting wait times by 10%. They also have gained insights on best-selling items to customize promotions, increasing sales by 22%. Real-time ingredient tracking helped them reduce waste and improve inventory management, driving 15% revenue growth.
Also Read: Automating Data Analysis Using Artificial Intelligence
2. Data Integrations(From Different Sources):
When data is scattered across different departments—finance using one system, sales using another, and operations tracking performance separately—businesses get a fragmented view of the business, leading to conflicting reports, inconsistent performance tracking, and missed growth opportunities.
BI dashboards solve this challenge by integrating multiple data sources into a single, centralized interface. Let’s understand better.
- With BI dashboards, decision-makers get a clear, unified view of key business metrics in one place instead of juggling different software platforms.
- Businesses get a complete understanding of how different business areas, such as finance, sales, marketing, and operation,s are performing, providing a complete understanding and identifying where there is a gap.
- With end-to-end integration, executives gain the ability to track revenue trends, customer acquisition costs, operational efficiency, and profitability in real time.
For example, Walmart, the world’s largest retailer is using BI dashboards to get a comprehensive view of their operations. They integrate data from various sources, including sales transactions, inventory levels, weather patterns, and social media, for quicker decision-making and more responsive supply chain management. As a result, Walmart reduced stockouts by 16%, improved inventory turnover rates, and enhanced customer satisfaction through personalized marketing efforts.
Also Read: How Data Analytics helps Restaurants Optimize Menus
3. Real-Time Data Insights:
Traditional reporting methods come with a significant lag. By the time reports are compiled, reviewed, and shared, the data is already outdated. This delay can lead to missed opportunities in fast-moving industries and decision-makers are forced to act on historical data rather than real-time insights.
BI dashboards change the game by offering real-time data access. Here’s how?
- Track insights on the go: Executives can instantly track performance indicators, monitor financial health, and respond to operational challenges as they happen.
- Right updates and decisions at the right time: Real-time dashboards provide insights on cash flow fluctuations, tracking supply chain disruptions, or adjusting marketing strategies in real-time, so decision-makers can make adjustments and decisions at the right time.
- Identify performance and work accordingly: No more waiting for monthly reports—leaders get up-to-the-minute data to identify what’s working, where there is room for improvement, and when to pivot strategies and make data-driven decisions with confidence.
For example, Toni & Guy, a prominent hair salon franchise in North America, operating over 1,800 locations is utilizing different tools and facing challenges with fragmented data and inconsistent reporting. To address these issues, they integrated a BI dashboard to get end-to-end insights across all locations and identify gaps. With this, they solved common challenges, curated SOPs, and ensured consistency in the operations to streamline operations and accelerate growth.
Also Read: Real Time Analytics Why Does Your Business Need it
4. Enhancing Data Accuracy and Consistency:
One of the biggest frustrations for decision-makers is dealing with inaccurate, outdated, or conflicting data. When reports don’t align across different departments, it creates confusion and mistrust in the numbers. Financial reports may show one revenue figure while sales reports reflect another, leading to misinformed business strategies and poor resource allocation.
BI dashboards solve this problem by enforcing data accuracy and consistency across the organization.
- Standardize the data collection: BI dashboards help businesses standardize data collection processes, apply validation rules to detect discrepancies, and ensure that all reports pull from the same verified sources.
- Single source of truth: There will be no more conflicting reports or second-guessing numbers—everyone in the organization works with a single source of truth.
- Accurate data: With data governance controls in place, CFOs, CEOs, and department heads can trust that the insights they rely on are accurate, reducing business risks and improving overall business performance.
- Better Forecasting: Accurate data enables precise demand forecasting, financial planning, and strategic decision-making.
- Improved Compliance: With proper data governance, businesses can meet regulatory and financial reporting requirements.
For example, Covéa Insurance, a prominent UK-based insurer, faced challenges in data accuracy and compliance due to fragmented data systems across departments. To address these issues, they integrated cloud-based Business Intelligence (BI) dashboard into their business processes. The BI solution helped track KPIs in real time, reduce manual errors, ensure compliance, identify discrepancies and make informed decisions. As a result, Covéa improved operational efficiency, reduced financial risks, and ensure compliance with evolving insurance regulations.
Also Read: The Role of Data Analytics in Reducing Restaurant Waste
5. Simplifying Data Interpretation:
Raw data in spreadsheets or traditional reports can be overwhelming, making it difficult for decision-makers to quickly identify trends and patterns. Scrolling through endless rows of numbers isn’t just tedious—it increases the risk of overlooking critical insights that could impact business strategy. It might delay the decisions as well.
BI dashboards simplify this process by transforming complex datasets into easy-to-understand visualizations.
- Real-Time Data Visualization: Executives can track KPIs through interactive charts, graphs, and heat maps, eliminating the need to sift through spreadsheets.
- Comparative Analytics: Businesses can compare current performance against historical data, industry benchmarks, or competitor metrics to make informed decisions.
- Data Storytelling: Visual elements transform raw numbers into compelling narratives, making insights easier to communicate across teams.
- Customizable Dashboards: Decision-makers can tailor dashboards to display relevant metrics, ensuring they see the most critical data for their role.
For example, the City of Hope Comprehensive Center implemented BI dashboards to get real-time insights into physician performance, patient safety, hospital resource utilization, and financial metrics. The BI dashboard also improved documentation accuracy, ensuring compliance and financial integrity. By transforming complex datasets into intuitive visualizations, the BI dashboards empowered clinicians and administrators to make data-driven decisions for improved patient outcomes, operational efficiency, and overall healthcare excellence.
Also Read: How Data Analytics Process Automation Help Businesses
6. Customizing Data Views for Role-Specific Analysis:
Every decision-maker within an organization has different priorities. A CEO may need a high-level overview of business performance, while a CFO focuses on cash flow and profitability. Meanwhile, a sales manager is more concerned with pipeline performance. Traditional reports often present a one-size-fits-all approach, forcing leaders to sift through irrelevant data to find what matters to them.
But that is not the case with BI dashboards; these offer a personalized solution to every user, and it helps them filter and segment data based on specific business needs.
- Customize dashboards as per their role: Leadership teams can customize dashboards to display the most relevant metrics for their role, whether that’s financial performance, sales conversions, or operational bottlenecks.
- Focus on the right data: With a BI dashboard and its targeted approach, decision-makers aren’t overwhelmed with unnecessary data and can focus on the insights that drive their specific responsibilities.
- Drill-down analysis: Users can easily drill down into specific time periods, geographic regions, customer segments, or product categories ,further enhancing strategic decision-making by providing tailored insights in real-time.
- Automated Alerts & Notifications: Decision-makers receive automated alerts when key metrics deviate from set thresholds, allowing for immediate action and proactive problem-solving.
- Scenario Analysis & Predictive Insights: Users can simulate different business scenarios and predict outcomes based on historical trends, helping leaders prepare for future challenges and opportunities.
For example, the New York City Department of Transportation (NYC DOT) uses BI dashboards for traffic management. This dashboard provides real-time insights into traffic flow, helping to optimize road maintenance schedules, improve emergency response times, and reduce congestion. It even facilitates coordination among various transportation agencies, enhancing operational efficiency and public safety.
Also Read: Two Way Data Analytics in Shaping Retail Businesses
7. Predictive Analytics:
One of the biggest challenges businesses face is reacting to problems only after they occur. Without predictive insights, decision-makers rely on historical data, making it difficult to anticipate market shifts, customer demands, or operational disruptions.
Modern BI dashboards incorporate artificial intelligence (AI) and machine learning (ML) to generate predictive insights.
- Forecasting Demand: Predictive analytics helps businesses anticipate sales trends, helping businesses prepare for potential challenges and opportunities.
- Identifying Risk Factors: AI-powered dashboards detect potential risks, such as supply chain disruptions or financial inconsistencies, allowing proactive decision-making.
- Optimizing Pricing Strategies: AI-driven BI dashboards analyze market trends, customer behavior, and competitor pricing to suggest optimal pricing models, maximizing profitability.
- Improving Customer Experience: Predictive insights help businesses personalize customer interactions, anticipate preferences, and enhance loyalty programs based on buying patterns.
Example: A fast-casual restaurant chain uses a BI dashboard with AI-driven predictive analytics to optimize its supply chain and staffing. By analyzing past sales data, weather patterns, and local events, the system forecasted peak dining hours and adjusted inventory orders accordingly. This reduced food waste by 18% and improved labor scheduling, cutting overtime costs by 12%. As a result, the restaurant enhanced its efficiency, lowered operational expenses, and increased profitability.
Also Read: How Predictive Intelligence Transforms Retail
8. Actionable Insights:
Data without actionable insights is of no use. Businesses, when overwhelmed with a lot of unnecessary and unstructured data without any insights out of data, just waste your time and other business resources while also losing out on growth opportunities.
However, BI dashboards having AI and ML capabilities can change the data game for businesses. Collecting and analyzing end-to-end business data removes the guesswork and provides data-backed actions to power up decisions in real time.
For instance,
- If a restaurant’s best-selling dish is running low on ingredients, the system sends an alert to restock before it impacts sales.
- If a menu item is underperforming, it suggests launching a bundle deal or flat discount to increase sales.
- The dashboard also identifies slow hours and recommends turning them into happy hours to boost traffic and revenue.
- During peak times, it helps optimize staffing and streamline operations to ensure smooth service.
Organizations use a range of operational and analytical dashboards to help decision-makers at all levels of the company. The following are some common types of BI dashboards developed for different purposes.
Also Read: Leveraging Collect Actionable insights
Different Types of BI Dashboards to Take Data-Backed Decisions!
1. Sales and Marketing Dashboards:
Managers, sales and marketing teams, and business executives all use this kind of dashboard. A sales dashboard contains all the insights about month-on-month sales, sales growth, sales operations costs, and other relevant KPIs. It assists users in identifying what is happening in terms of sales and what necessary steps can be taken as per the results. Similarly, a marketing dashboard includes information on marketing performance, marketing costs, ROI, performance on different channels etc, to adjust the marketing strategy in the right direction and maximize ROI.
Also Read: AI for Restaurant Marketing
2. Operational Dashboards:
These dashboards focus on the real-time monitoring and status of operations, business processes, and equipment, and sync it. Operational dashboards help frontline managers and teams track live performance data, detect bottlenecks, respond quickly to issues, and improve end-to-end operations.
Also Read: How to Set Up KPIs for your Business
3. Human Resources Dashboards:
A human resources dashboard offers HR managers and business executives relevant information on an organization’s staff. This covers hiring and recruiting analytics and KPIs on areas like employee satisfaction, turnover, and expenses, as well as fundamental workforce data like the number of employees, wage information, and demographics. Initiatives related to employee experience and talent management benefit from this data.
Also Read: AI to Collect Customer Insights
4. Financial Dashboards:
This form of dashboard provides financial KPI data for the CFO, other management, and finance department staff. A financial dashboard displays indicators such as revenue, operational expenses, cash flow, and profitability, as well as cash holdings, assets, and liabilities. It assists businesses in evaluating their financial situation and making appropriate financial management decisions.
Also Read: Automating Data Analysis Using Artificial Intelligence
5. Customer Dashboards:
A customer dashboard allows users to monitor and evaluate data about an organization’s customer base, such as size, churn and retention rates, revenue per customer, lifetime value, and other customer metrics that can be used to plan marketing and sales initiatives.
Also Read: AI for Expanding Restaurant Customer Base
6. Strategic Dashboards:
Executives, senior management, and decision-makers rely on strategic dashboards to monitor high-level business performance, long-term objectives, and key performance indicators (KPIs). These dashboards provide high-level insights into overall business health, market trends, and revenue performance.
Also Read: Top 9 Challenges of Business Analytics
Choose Livelytics BI Dashboards for Your Business:
If you are looking for BI dashboard tools for your business, then you can check out Livelytics. It is an AI data platform with sophisticated technologies such as BI, ML, NLP, predictive intelligence, and automated intelligence to power BI dashboards and take their data game to new heights of success.
1. Seamless Integrations:
Easily connect with existing business systems, including CRM, ERP, POS, marketing platforms, and financial databases, ensuring a smooth data flow across all operations.
2. End-to-End Data Support:
Livelytics is your end-to-end data partner – helping businesses with data integration, cleansing, transformation, reporting, and data visualization with BI dashboards.
3. AI-Powered Intelligence:
Livelytics AI, ML, and NLP capabilities enable businesses to automate analytics, predict market trends, track performance metrics, and uncover hidden patterns for strategic decision-making.
Also Read: The Role of Machine Learning in Business Analytics
4. Customizable BI Dashboards:
Unlike rigid, one-size-fits-all dashboards, Livelytics offers fully customizable dashboards tailored to specific business needs, KPIs, industry, department, and even user requirements.
Also Read: What is Business Intelligence and why does it matter?
5. Ask & Get Answers with LivAI:
With LivAI – Livelytics very own AI co-pilot businesses can simply ask questions like “What were my top-selling products last quarter?” or “Which location has the highest footfall?”, and get instant insights on their BI dashboards.
6. Interactive & Dynamic Visualizations:
Livelytics BI dashboards provide highly interactive and dynamic data visualizations with real-time charts, graphs, heatmaps, and trend lines, helping businesses monitor key metrics at a glance.
If you would like to try out how it integrates, works, and benefits your business – book your free Livelytics demo today.
To Wrap Up!
At the start of the blog: if businesses are unaware of the BI dashboards and how they can transform the way businesses collect, access, play, and make the most out of their data, then we hope this blog did justice.
We have covered everything – right from the basics of BI dashboards to the role of BI dashboards in data collection, different types of BI dashboards that businesses can use and why Livelytics AI can help.
So, make sure to choose the right BI dashboard tool that makes these easier for you. No tech knowledge or hassles, just clear and insightful data to make decisions. For each Retail, Hospitality, salon, Restaurant, and Insurance businesses Livelytics is here. Do try today itself, book your free demo.