Introduction
As enterprises of all sizes want to leverage the power of data analytics, a significant dilemma emerges: manual data collection, management, and analytics are difficult and time-consuming.
Thank you for reading this post, don't forget to subscribe!More than 40% of workers say they spend at least 25% of their workweek on manual, repetitive jobs. High-level tasks would be a better use of that time. That time could be better used for higher-level work.
This traditional approach frequently results in bottlenecks, exhaustion of resources, and missed possibilities.
However, we have a solution: a platform for data analytics automation. It assists you in automating all steps of the data analytics process, including data collection, cleaning, transformation, visualization, and analytics. It frees up critical time and resources for more impactful tasks, transforming how companies function in the data-driven era.
In this comprehensive guide, we’ll look at how automation may help businesses increase agility, reduce expenses, and maximize the value of their data assets.
What is Data Analytics Process Automation?
Automated data analytics is the process of collecting, processing, analyzing, and displaying data using automated tools and workflows rather than manual methods. The goal is to speed up the analytical process so that insights are available faster and are available in a convenient manner.
At a high level, automated data analytics involves connecting data sources, creating pipelines to collect and process data, implementing analytical models and algorithms, and delivering outputs such as dashboards and reports.
Rather than doing each step manually, the goal is to use technology to automate parts of the process. Automation in data analytics can reveal insights that would otherwise be unavailable to an organization.
It is a unified platform that streamlines and automates data analytics and data science procedures to make data easily available and accessible for everyone in the business. These tools include sophisticated technologies like machine learning (ML) artificial intelligence (AI), and predictive and prescriptive analytics to make informed choices.
Also Read: Two Ways Data Analytics is Shaping Retail Businesses!
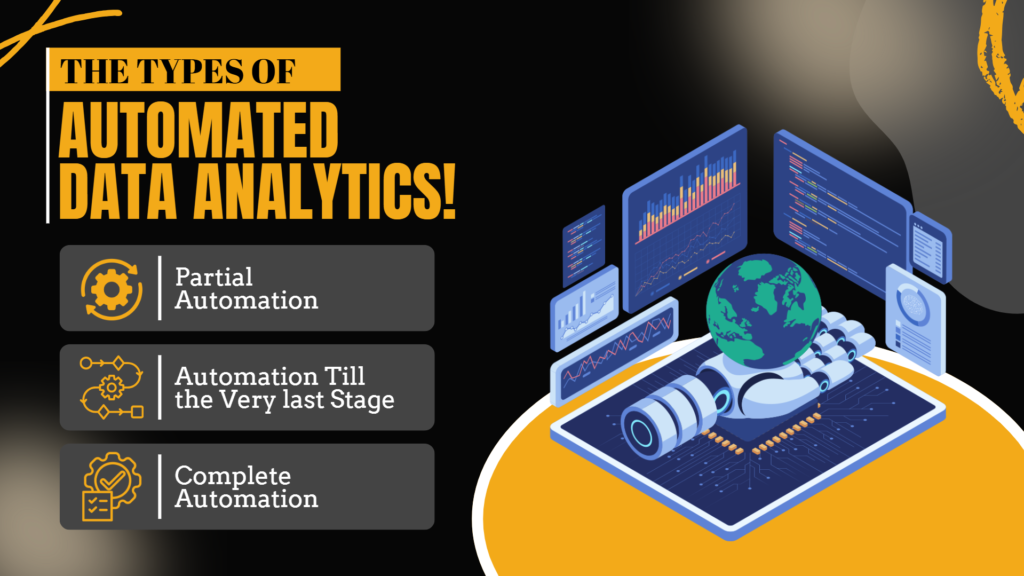
The Types of Automated Data Analytics!

The degree of automation you’re considering will determine how you utilize data analytics.
- Partial Automation:
It is possible to automate current procedures partially, which removes part of the manual effort. For example, the data analysts on your team would write scripts to expedite particular parts of their work.
- Automation Till the Very last Stage:
Automation is configured from start to finish, and the platform can provide information products for humans to review and decide on. Automation can generate KPI dashboards or fraud alerts without requiring employee intervention. But, what action to take regarding the same would require human intervention.
- Complete Automation:
Complete automation allows businesses to make choices in near-real time with no human intervention. For example, an AI algorithm can detect when supply levels are at their lowest automatically and notify the supplier when stock needs to be refilled.
As you proceed toward complete automation, the benefits of automation expand from simply saving time to having independent benefits on the company’s bottom line.
Also Read: Choosing the Right AI Data Platform for Your Business
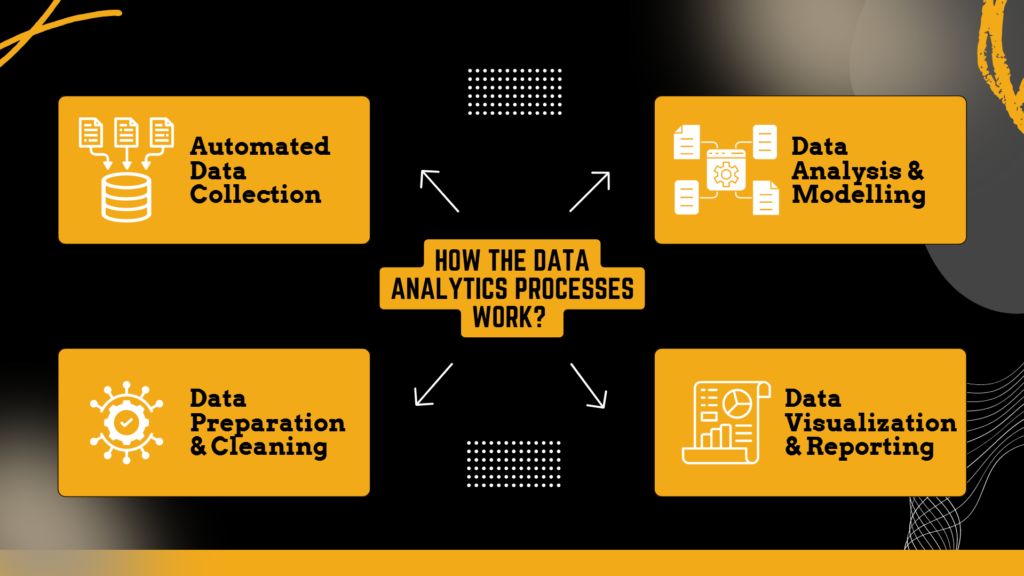
How the Data Analytics Processes Work?

Before getting to the details of the best strategies for automated data analytics and how to choose the right platform for your data analytics, it is important to understand how it works to get the most out of data for your business.
1. Automated Data Collection
The first step in automating data analytics transformation is to acquire data. Data must be obtained in order to be analyzed.
However, gathering the data can take a while. It can take a lot of time and human resources to gather the data sets required for analysis, from locating all the scattered Excel files to creating a script that pulls data from third-party apps.
When you choose the data automation platform, it helps you seamlessly integrate with all the third-party platforms to source data(from structured and unstructured platforms) to get all the data in one place.
By automating data gathering, you can reduce the amount of time it takes to deliver data analysis. To keep your incoming data up-to-date you can leverage technologies to automatically extract the data from multiple data sources and use it for further data processing.
2. Data Preparation & Cleaning
Once data is collected, it needs to be prepared and transformed for analysis. This critical phase, often referred to as ETL (Extract, Transform, Load), is where raw data is refined into a format suitable for analysis. The ETL steps are coded into the automated system, ensuring consistency and efficiency in data processing.
The process begins with data cleaning, which involves identifying and correcting errors, inconsistencies, and inaccuracies in the dataset. Automated scripts can detect and handle missing values, remove duplicates, and standardize formats across different data sources.
Next, the system performs various transformations to make the data analytics-ready. It includes integrating data from multiple sources, filtering out irrelevant information, and aggregating data to the appropriate level of granularity.
This speeds up the analytics process and frees up data scientists and analysts from tedious data-wrangling tasks. So, in the end, you’ll get a clean, well-structured, and analytics-ready dataset for further analysis.
3. Data Analysis & Modelling
With clean, prepared data in place, the automated system moves on to the analysis and modeling phase. This step is where the real value of data begins to materialize, as raw information is transformed into actionable insights.
The data analytics platform uses different techniques, from basic statistics to advanced machine learning, to analyze data. For routine tasks, it runs scripts automatically to create regular reports on important business metrics, like sales trends, customer churn rates, and operational efficiency.
Predictive models can forecast future trends based on historical data. These models might predict customer behavior, market demand, or resource needs. These models can uncover complex patterns and relationships in the data that might not be apparent through traditional analysis methods.
Businesses can generate insights at a scale and faster speed by automating these analytical processes. It helps with agile decision-making and helps organizations stay ahead in fast-moving markets.
4. Data Visualization and Reporting
It is always overwhelming to look at a huge spreadsheet full of numbers, right? Well, this is where the magic of visualization comes in. It’s like turning those boring graphs and charts that everyone in your team can understand. These visuals update automatically, so the team always has the latest information at their fingertips.
Now, here’s the cool part – these dashboards are customizable. If sales person, knows how sales are doing in a specific region? They just need to click and zoom in. Curious about last month’s performance? Filter it with a simple button press. It’s so easy, anyone in the company can do it, whether you’re the CEO or working in customer service.
And you know those reports that used to take hours to compile? They’re now created automatically. But wait, there’s more! The system is smart enough to give you a heads-up when something important happens.
All of this makes everyone in the company feel more connected to the data. It’s no longer this complicated thing that only the “data people” understand. Now, everyone can get it, making smarter decisions based on real information.
Let’s Understand How the Retail Giant is Leveraging Automated Data Analytics!
Walmart is one of the world’s largest retail chains, having a presence in around 25 countries and owning more than 10000 stores. Now, as good as it sounds-it comes with quite a challenge. And, one such common challenge is efficiently managing its vast inventory.
1. Understanding the Challenge:
With millions of products moving through its supply chain daily, Walmart needed to ensure that the right products were in the right place at the right time. Previously, the company relied on manual processes and historical sales data, which often led to inefficiencies like overstocking or running out of popular items.
2.Implementing Data Automation Platform:
Walmart set up an automated data analytics platform that uses machine learning to analyze over 200 billion rows of sales data every two weeks. The system gathers data from various sources, like in-store sales, online purchases, and weather reports.
For example, when it spots a cold front coming, it increases the stock of winter clothes and hot drinks in the affected areas. It also tracks local events, social media trends, and competitor prices to adjust stock levels and prices in real time.
3. The Change:
Walmart reduced stockouts by 10-15% and improved inventory turnover by 8% – because products were moving products off the shelves faster and reduces holding costs. Automated data analytics helped Walmart respond quickly to changing customer demands, keeping shelves stocked with what customers wanted.
With products more consistently available, customers find what they need more often, which boosts their satisfaction and loyalty. And, automation helped Walmart save about $1 billion annually in supply chain costs by optimizing logistics, reducing waste, and boosting overall efficiency.
Also Read: How Predictive Intelligence Transforms Retail
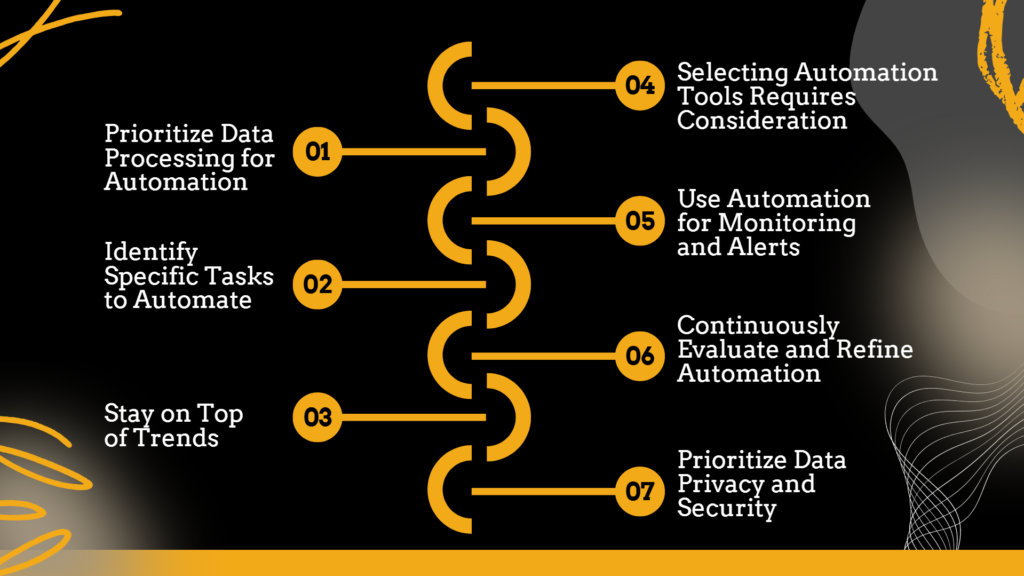
The Best Data Automation Strategies You Should Keep in Mind!

Before implementing a data automation solution or changing an organization’s data operations, it is critical to develop a plan that aligns with the organization’s data management strategy. The following are the stages to take while creating a data automation strategy.
1. Prioritize Data Processing for Automation:
Sort and assess the most time-consuming data processing procedures. Pipelines are a fantastic place to start because they run regularly and require a number of human procedures that may be automated. Because of this, data engineers are able to focus on more intricate or important tasks.
For instance, if a pipeline requires manual quality checks or adjustments to handle exceptions, you can automate these steps with scripts or machine learning algorithms that help in detecting and addressing anomalies.
Automation helps businesses save time and minimize errors to create a more efficient data processing environment for data engineers and managers to focus on more strategic business activities.
2. Identify Specific Tasks to Automate:
Once the organization has determined which process to automate, the following step is to evaluate the manual jobs in each process and choose which should be automated first.
- Focus first on tasks that take up the most time and are prone to mistakes, as automating these will have the biggest impact.
- Consider how often each task is done; automating daily or weekly tasks will save more time than those done occasionally.
- Finally, prioritize tasks that, once automated, can be easily scaled up to handle more data or be applied to other areas of the business.
By focusing on these factors, you can decide where to start with automation, freeing up your team to work on more valuable tasks.
3. Stay on Top of Trends:
The technological landscape is constantly changing, particularly in the field of data automation. Artificial intelligence (AI) and machine learning (ML) technologies are among the most significant advances that are expected to gain increasing popularity.
Even if these technologies are already in use, algorithms are becoming increasingly complex with time. So, while picking the self-service data analytics platform, make sure it incorporates these capabilities to remain on top of trends and competitors while delivering the best-in-class and relevant experience for your clients.
4. Selecting Automation Tools Requires Consideration:
Even though a company is aware of the particular needs of your process, it’s crucial to select the appropriate data automation tool. It is recommended to choose a platform based on its use cases, features, pricing, security, etc, and its beyond just what the process requires.
You need to dig down in research, check out the best tools, see if it aligns with your specific business & industry needs and you can book a free demo to understand how it works for your business and then make the right decision.
5. Use Automation for Monitoring and Alerts:
Automating the monitoring and important alerts is one of the best things you can do for your business. You know what’s going on and what requires your immediate attention to ensure seamless operations. You can customize the monitoring and alerts as per their importance for your business.
For example, you could automate alerts for low inventory levels in a supply chain, system downtime, or significant changes in key performance metrics. This helps you and your team respond quickly to potential problems, maintaining smooth operations without constant manual oversight.
6. Continuously Evaluate and Refine Automation:
Automation is not a set-it-and-forget-it process. You need to regularly review and assess automated workflows to identify how they are working, if there is anything you can change, or are there are new opportunities for improvement.
And, for that, you need to keep a constant check, you need to gather feedback from the team, track performance metrics, and stay up-to-date with the latest automation technologies. This ongoing evaluation helps to refine your approach, ensuring that automation continues to deliver value.
7. Prioritize Data Privacy and Security:
When handling your business’s and customer’s important data, you have to be very careful. So, when you are automating data analytics – you need to incorporate robust measures to protect sensitive data and ensure compliance with relevant regulations.
It includes encrypting data both in transit and at rest, regularly updating security protocols, and using access controls to limit who can view or modify data. Additionally, businesses should also conduct regular audits to identify potential vulnerabilities and maintain compliance with data protection laws, such as GDPR or CCPA.
Choose the Best Data Analytics Process Automation Platform in 2024!
In the end, it all boils down to choosing the right data analytics process automation that helps you make the most out of data-driven decisions. If the platform is not easy to use, tailored to your industry and personalized business needs, or maybe not future-proof, then it will not make sense.
So, research well, dig down, check out the compatibility, and book a free demo to choose the right data analytics process automation platform for your business.
If you are looking for one, Livelytics is one such platform. It is a one-of-a-kind AI-driven platform with sophisticated technologies with right features for the restaurant, retail, salon, and hospitality industry.
To know more about how it can help you, book a free demo & you can get started.
To Conclude
Accurate and uniform data is the lifeblood of data analytics, which lays the foundation for informed decision-making and a better future.
You just need to get the basics right and we hope that this blog has given you a better understanding of the fundamentals, different types of data analytics automation, and best practices of data analytics automation. With the best tool, you can effectively utilize data analytics automation that streamlines your business processes and data management.
With the expanding volume of data and its use cases, data process automation tools such as Livelytics can help you save company time, and money, enhance accuracy, and alleviate the time-consuming tasks that are keeping your team from getting more done.
If you would like to try out Livelytics, you can book a free demo & get started.
