Give Your Messy Data the Visual Appeal It Deserves with Livelytics!
Livelytics turns complex data into clear, interactive, dynamic visualizations to gain actionable insights at a glance and make data-driven decisions with ease.
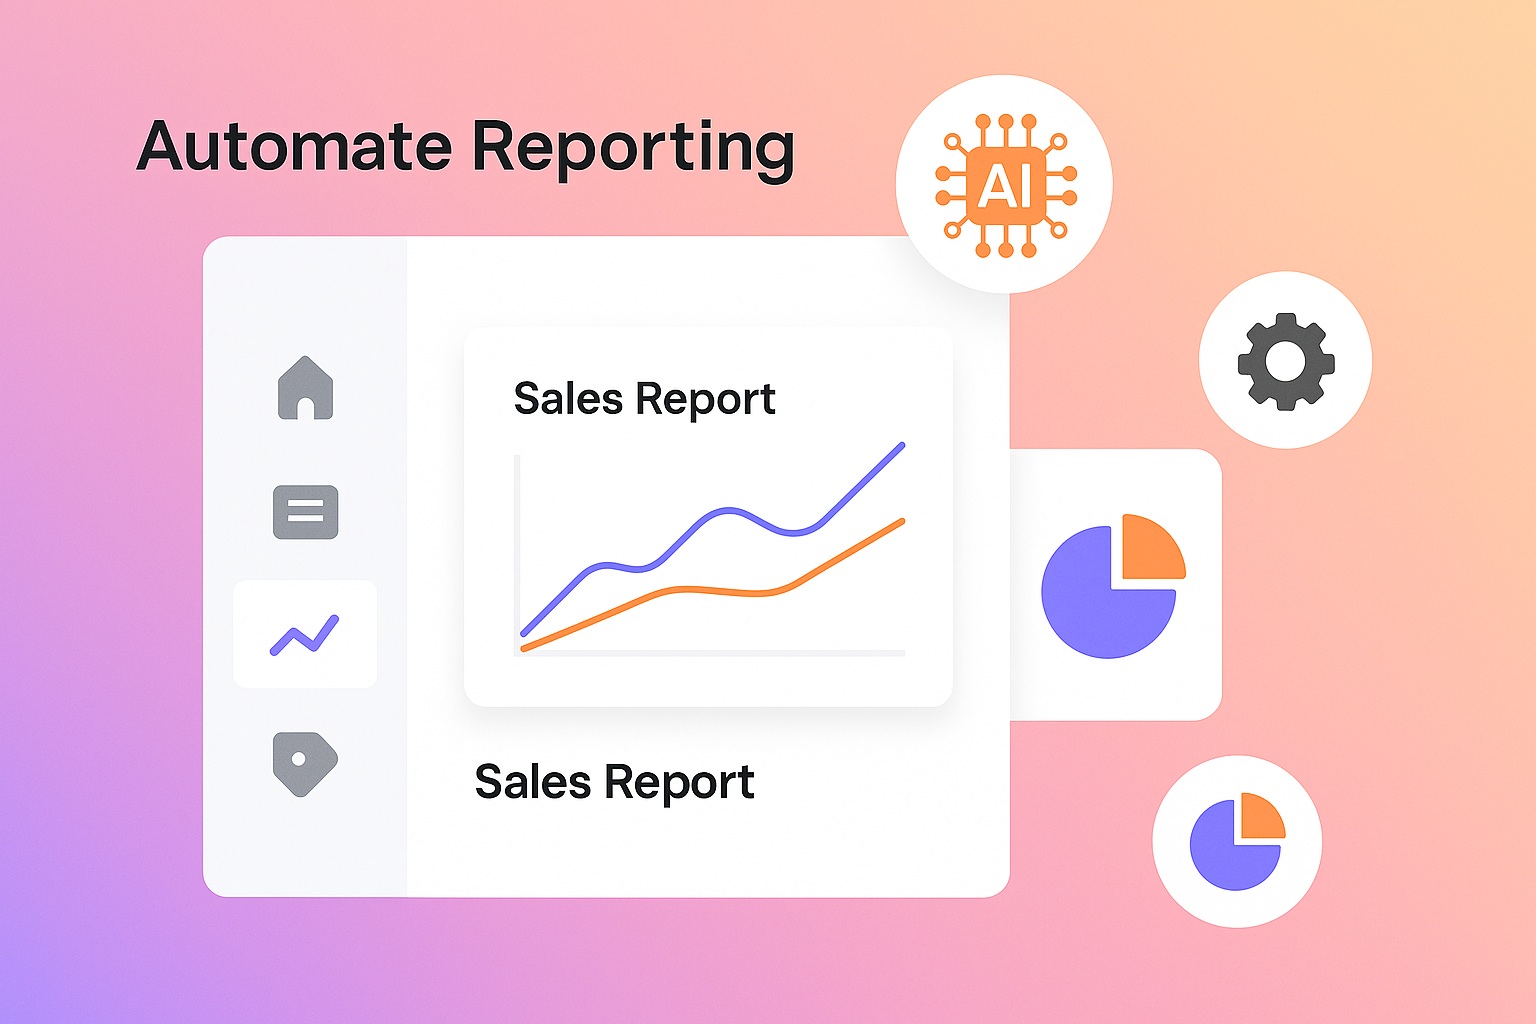
Automate Reporting On the Go
Livelytics helps businesses generate sales reports, purchase reports, marketing reports, etc - all of it in real-time and automated. It provides businesses with the latest insights at their fingertips - saving time and reducing errors.
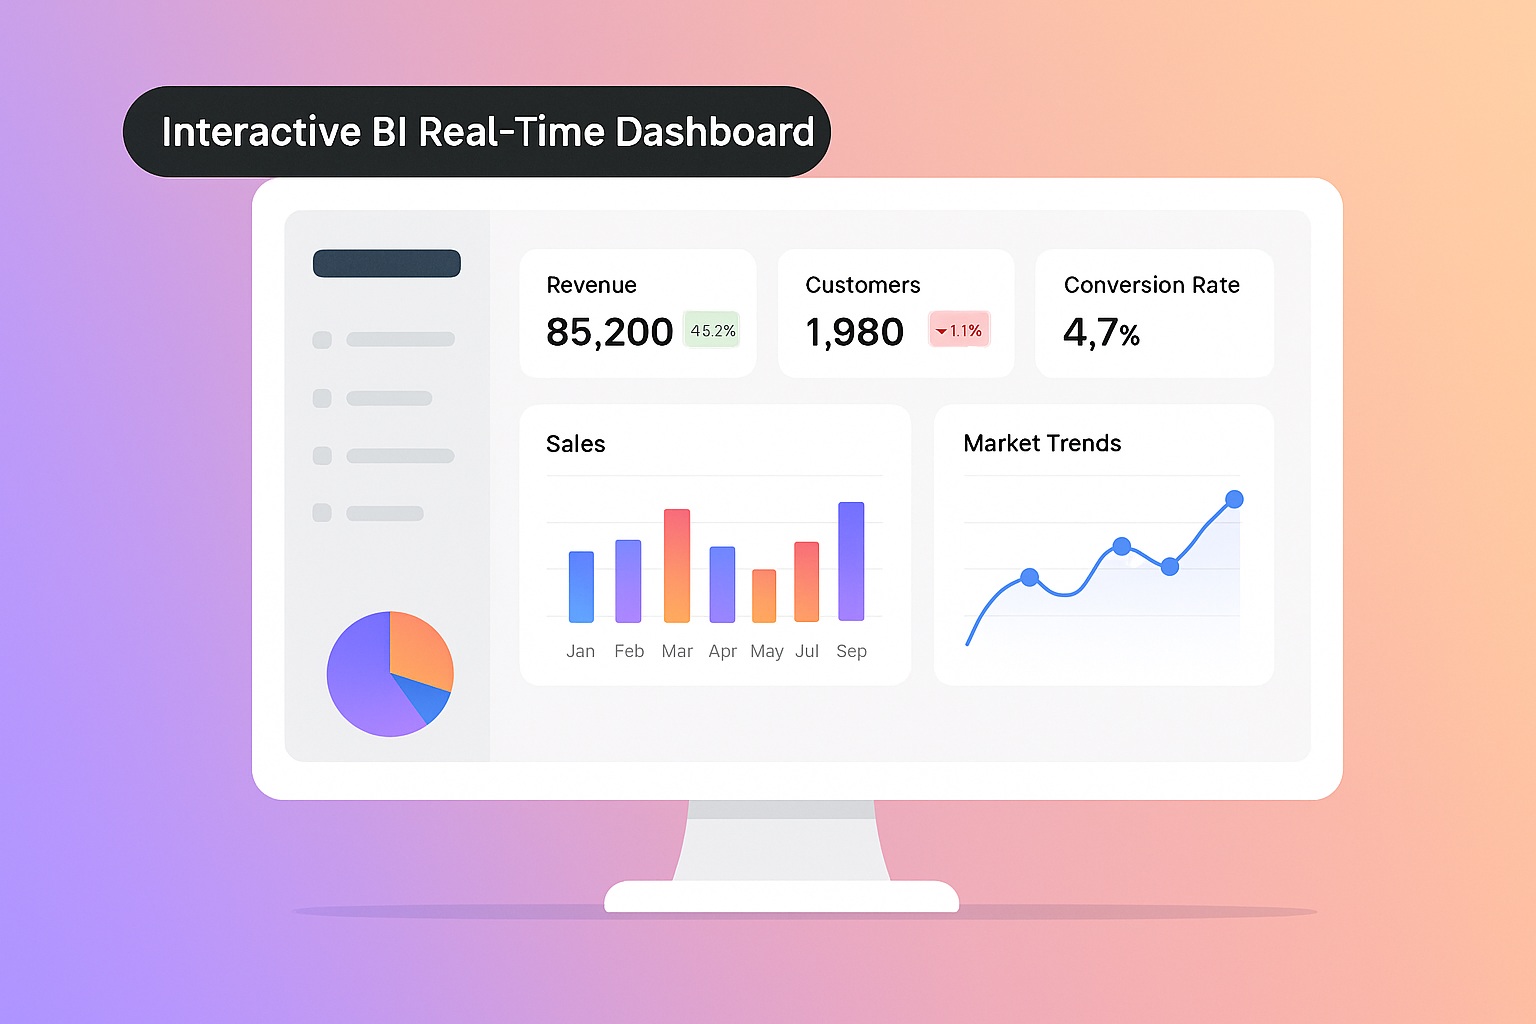
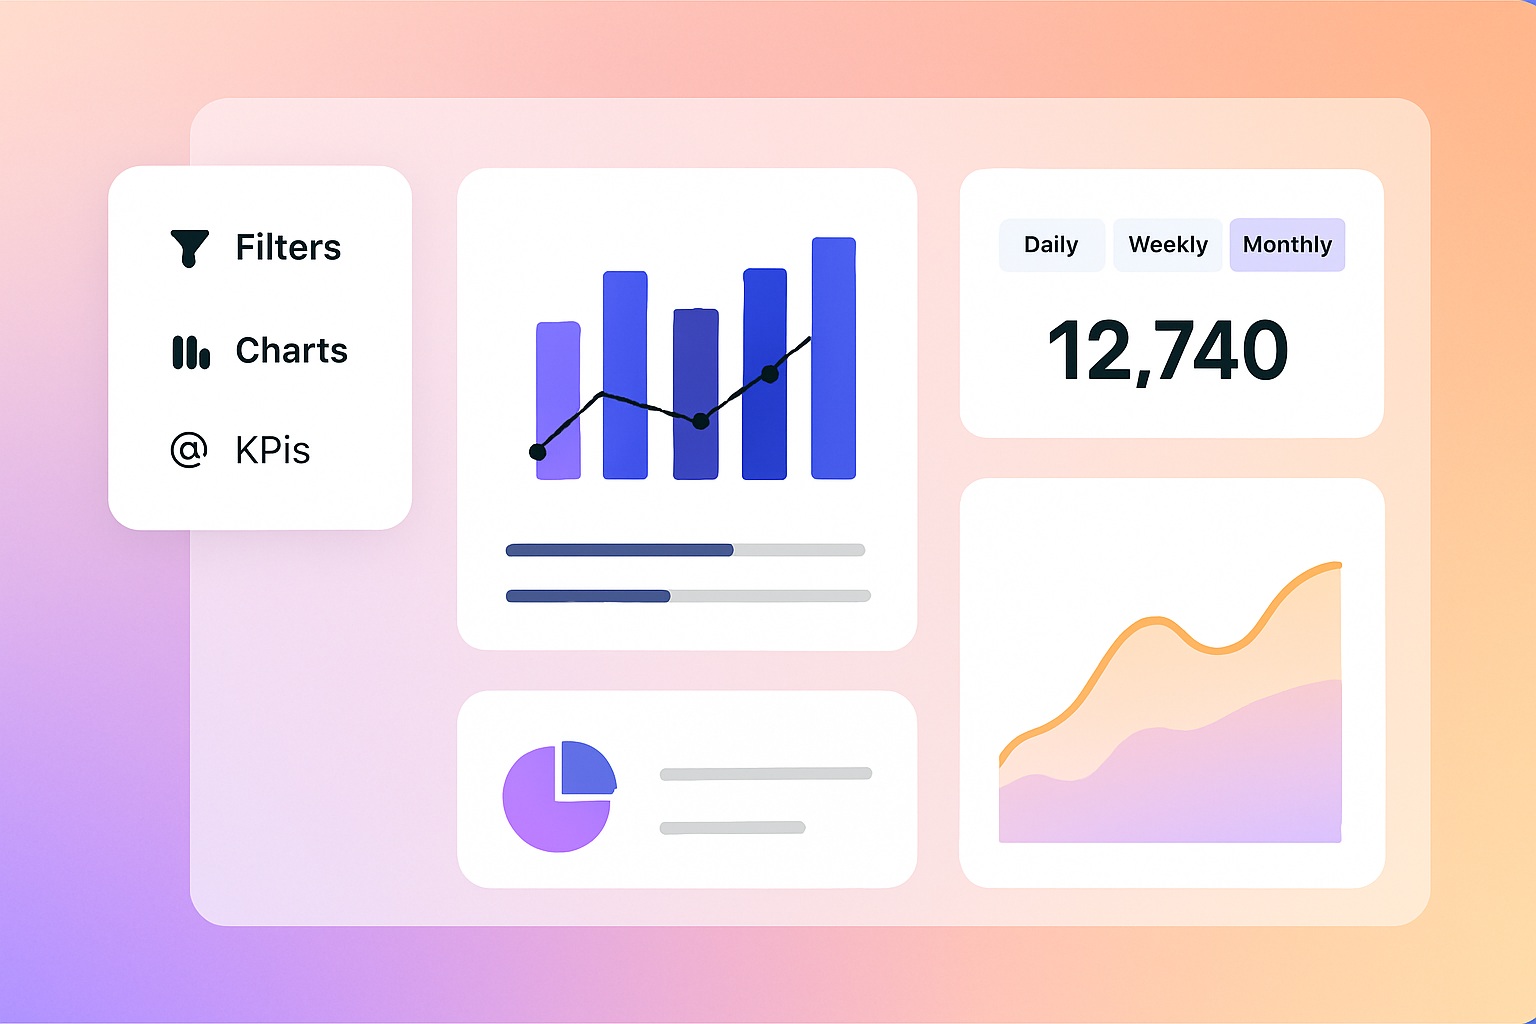
Interactive BI Real-Time Dashboard
Gain a 360-degree view of business performance with Livelytics interactive BI dashboards. Track key metrics, monitor sales, customer behavior, market trends - all of which in an easy and appealing manner for proactive decision making.
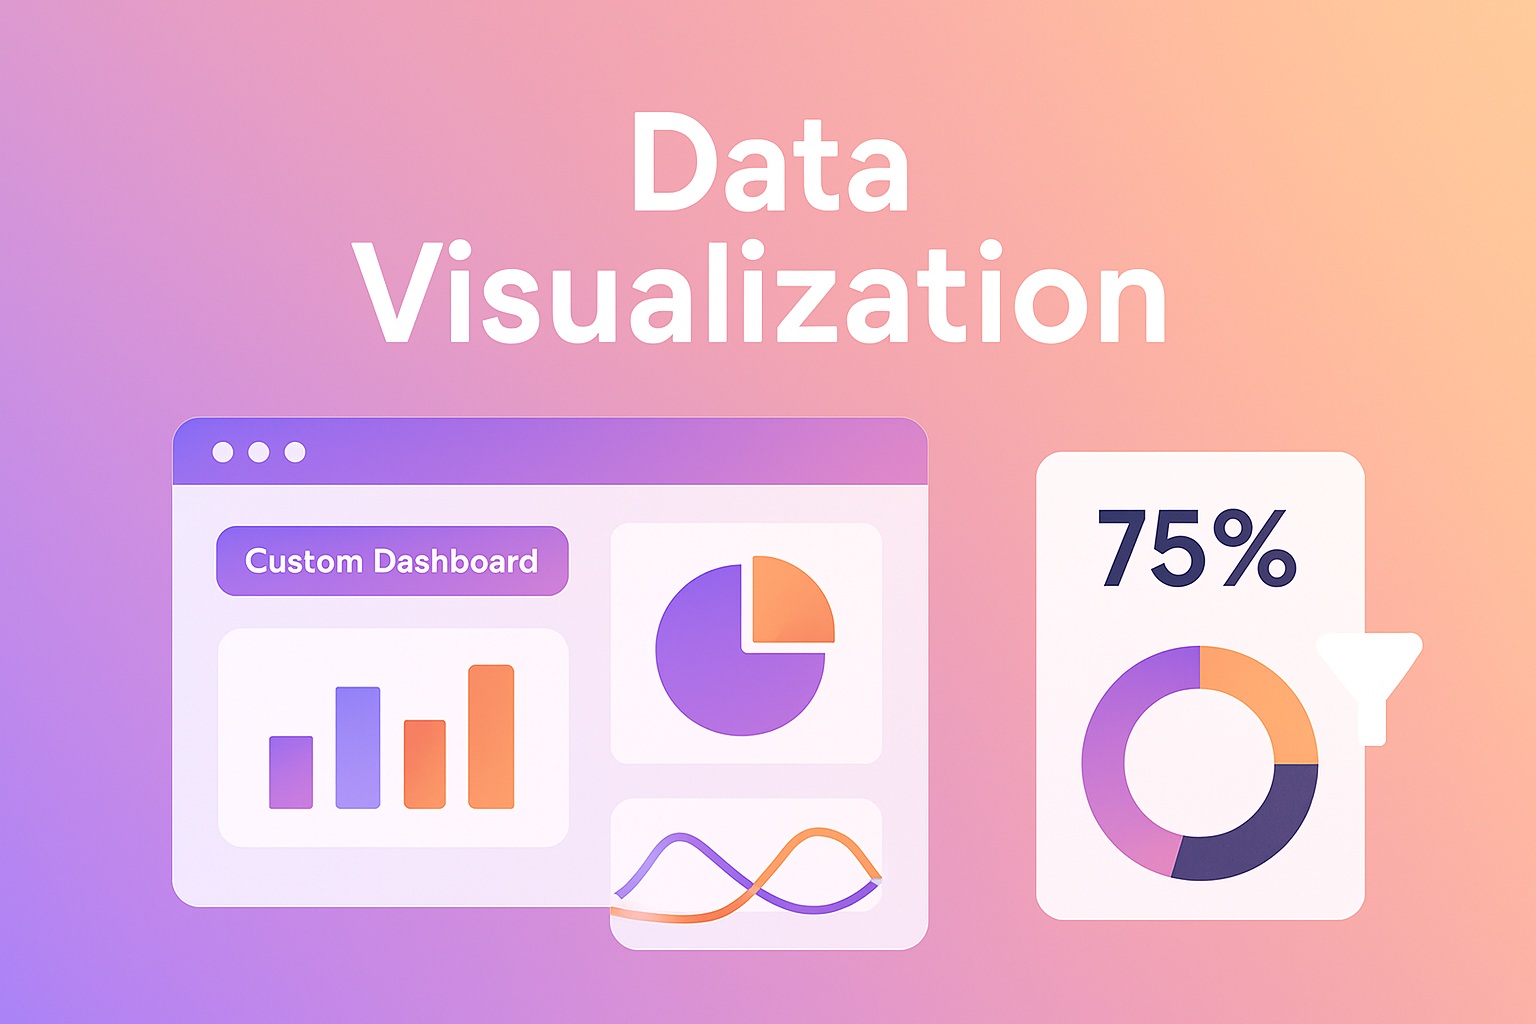
Enhanced Visual Appeal with Charts & Graphs
Transform raw data into visually appealing charts, graphs, and heatmaps with Livelytics. It helps you track everything, making it easy, accessible, and convenient to spot patterns, correlations to understand data better and optimize accordingly.
Customize Your Data, Your Way!
Every business is unique, and so is its data. So, businesses can seamlessly customize reports, filter insights, and focus on the KPIs that matter most to them with Livelytics' customizable data views feature.
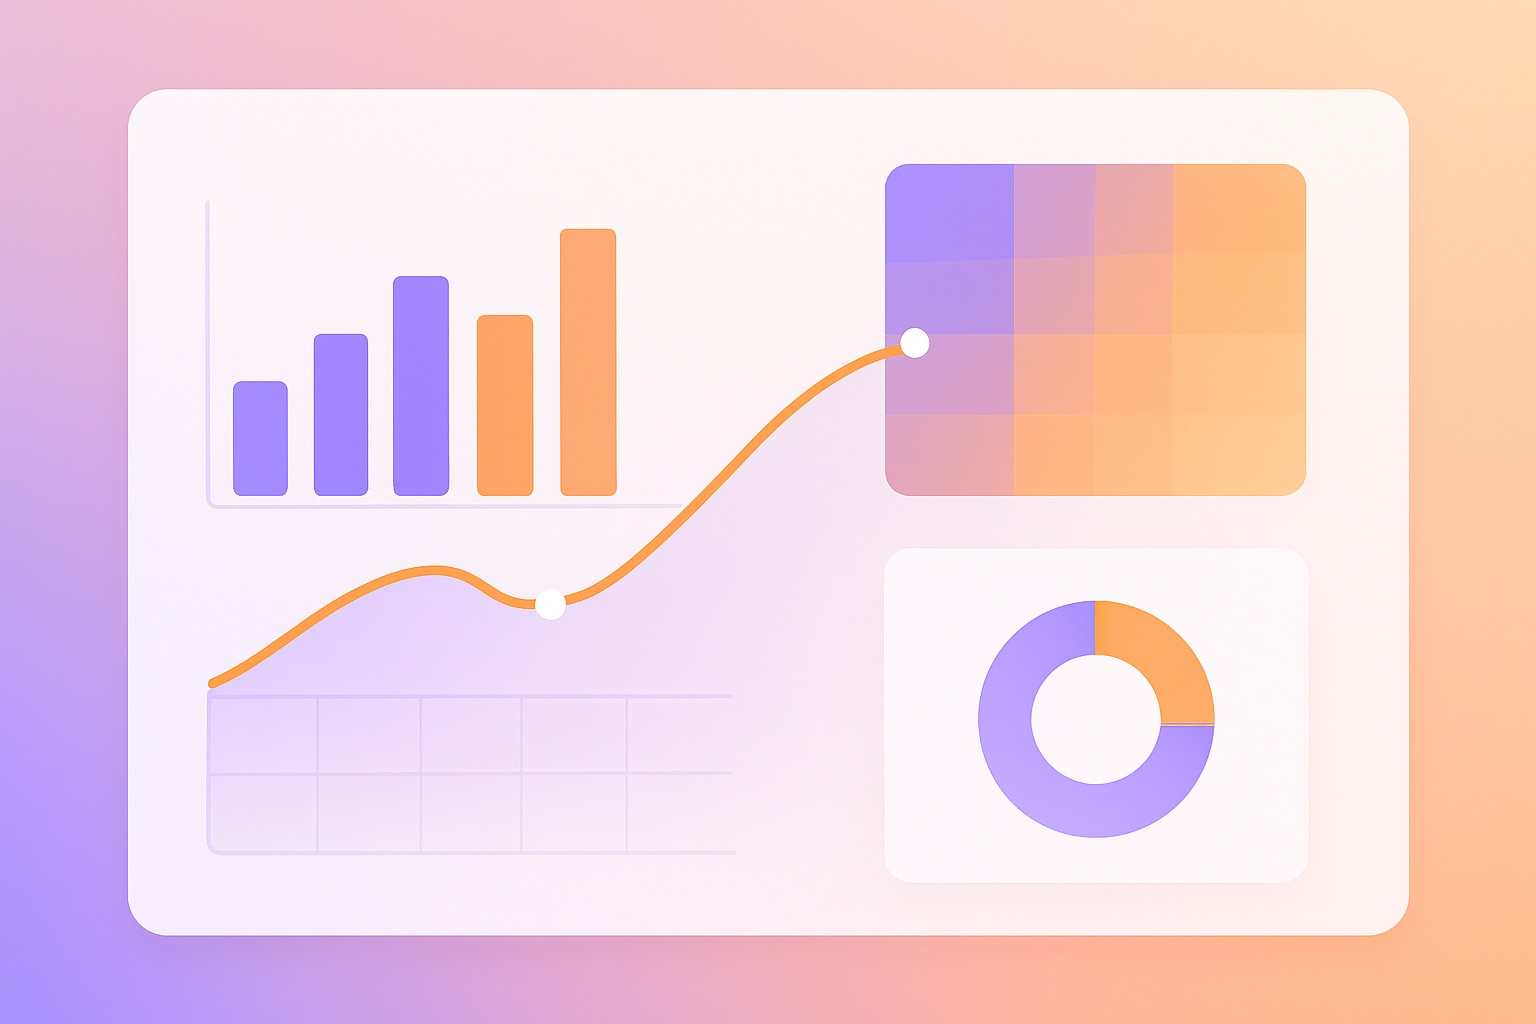
Transforming Raw Data into Visually Appealing Insights
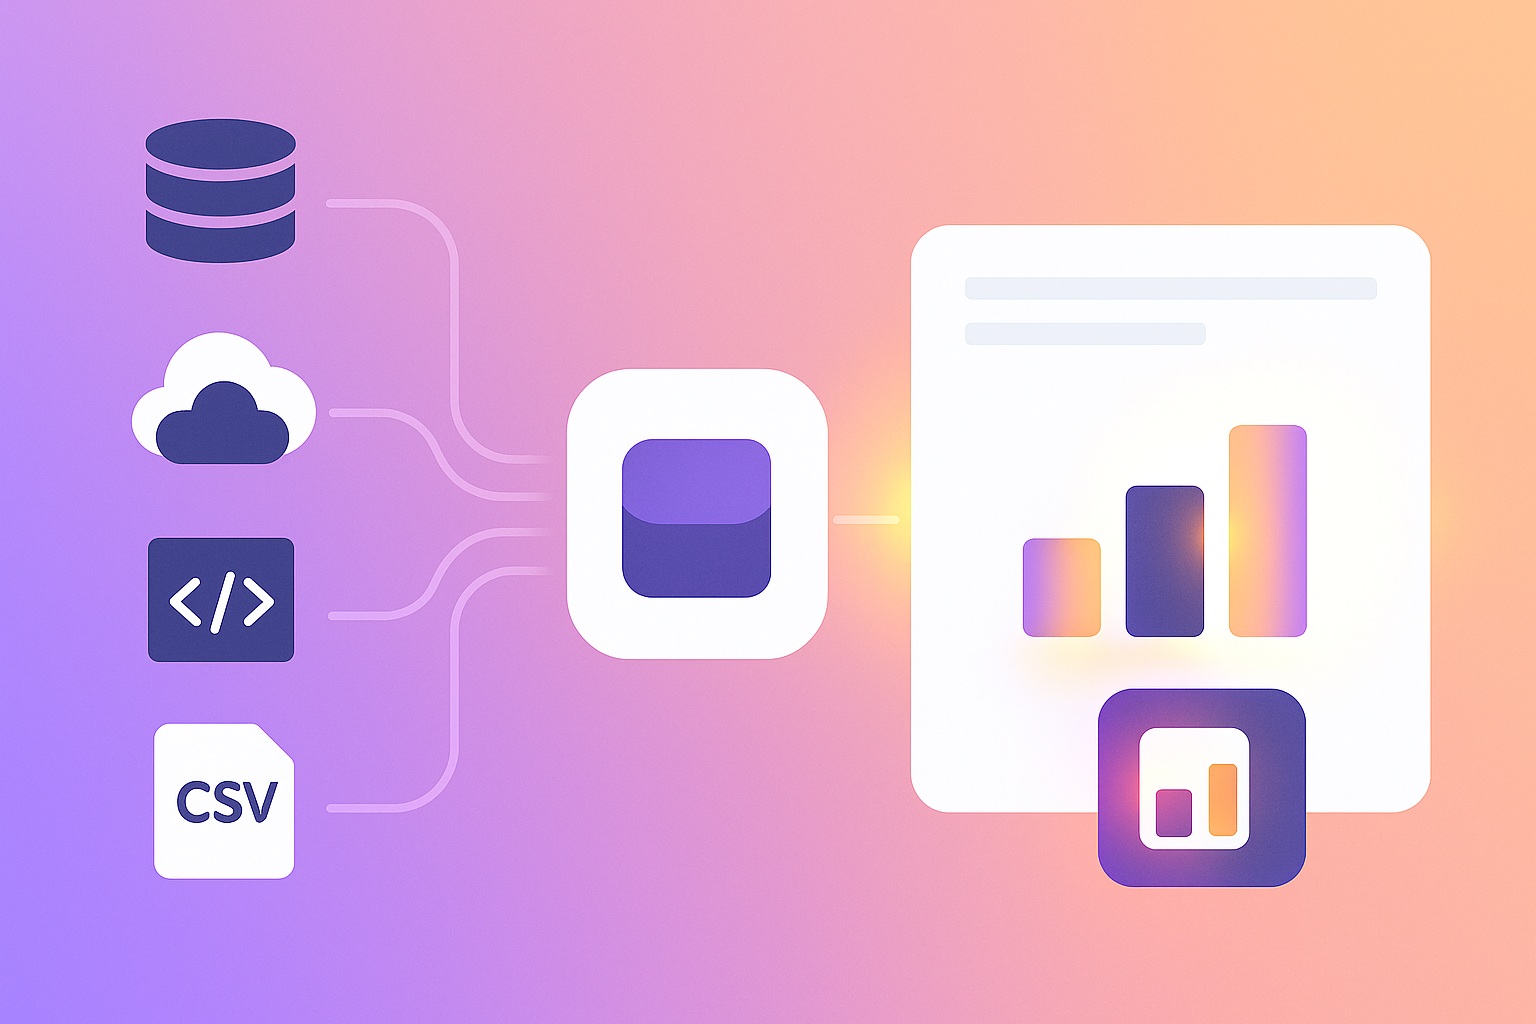
Unify Data from Multiple Sources
Livelytics seamlessly integrates, gathers data from various sources and consolidates it into a single, unified platform for seamless analysis without any manual intervention.
- Centralized data access
- Eliminate data silos
- Improves data consistency
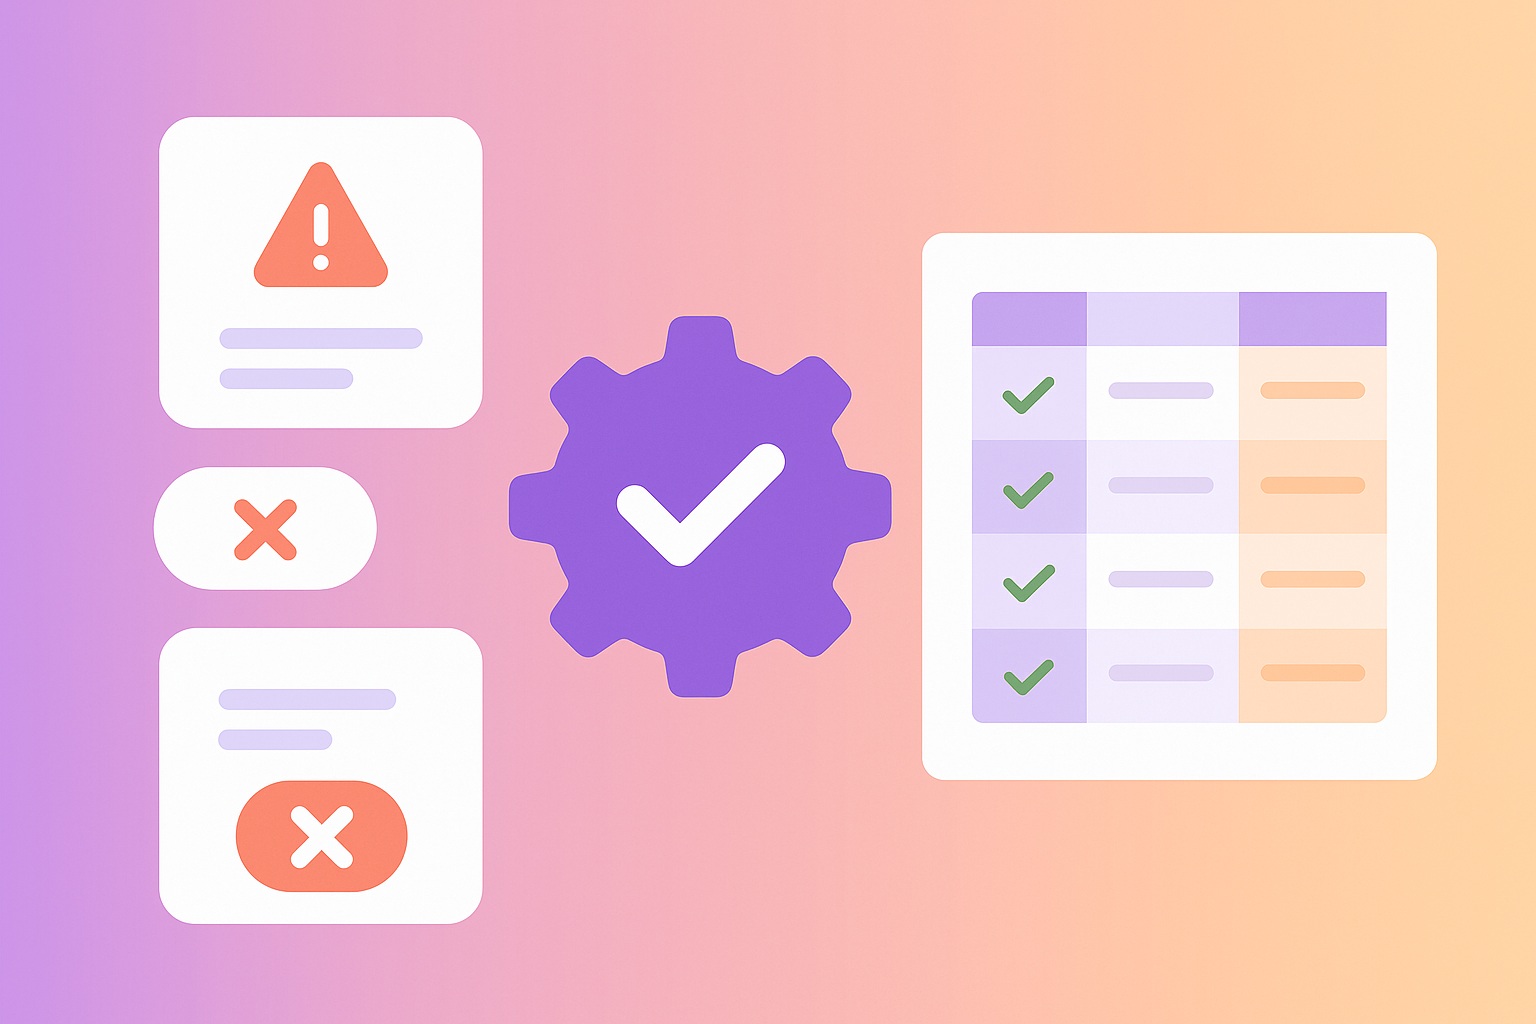
Refine Data for Best Accuracy & Clarity
Livelytics removes inconsistencies, duplicates, and errors to ensure clean, high-quality data. It then organizes information into structured categories for visualization.
- Error-free data & precise insights.
- Organizes data into meaningful categories.
- Better visualization accuracy
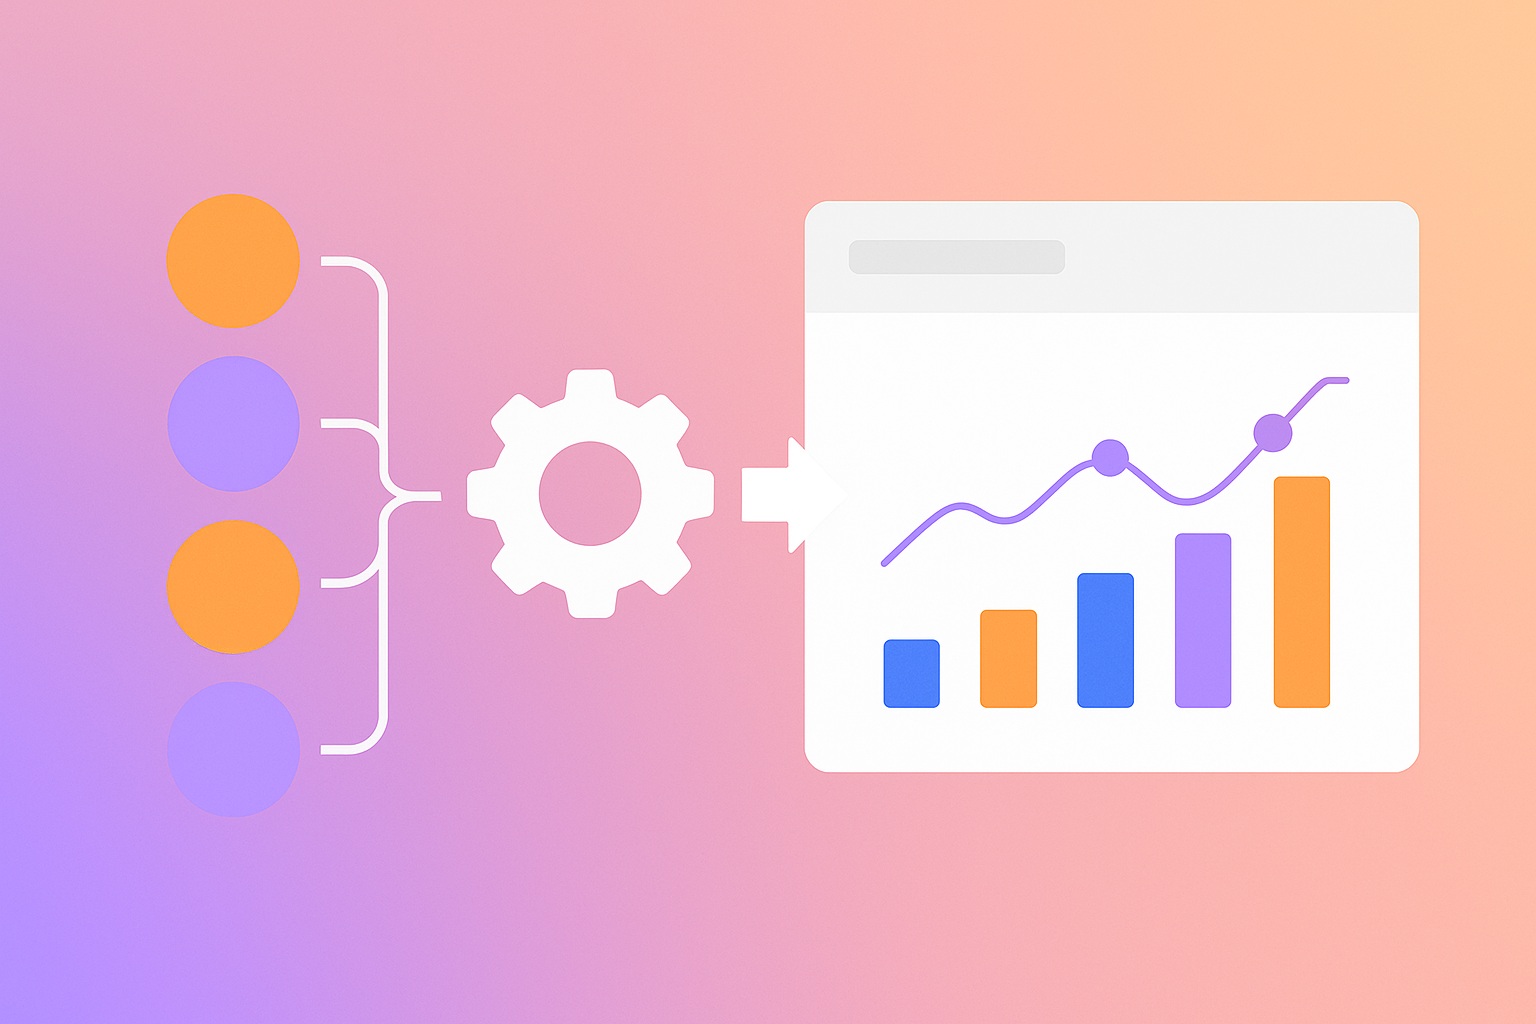
Connect Data to Relevant Business Metrics
Once structured, data is mapped to relevant business metrics, creating models that reveal the needed trends, correlations, and performance insights.
- Aligned & customized data mapping
- Advanced data modelling
- Foundation for deeper insights
Bring Data to Life with Interactive BI Dashboards
Livelytics transforms processed data into dynamic BI dashboards, charts, graphs, and heatmaps, making it easy for businesses to get a sense of their data and make decisions.
- User-friendly dashboards
- Customizable visualizations
- Actionable insights at a glance
Stay Ahead with Live Data Insights
Livelytics continuously updates dashboards with live data. This instant visibility helps businesses to respond quickly to changing markets and make decisions quickly.
- Live data tracking and updates
- Dynamic Business Operations Optimization
- Evolve with Business
Visualize Your Data Better with Livelytics AI
Bring your business data to life with intuitive visualizations that reveal trends, drive growth, and simplify decision-making for business.
Book a Demo