Introduction
Following the digital revolution, businesses were forced to acquire and manage massive amounts of data to make choices, create results, and maintain a competitive advantage.
Thank you for reading this post, don't forget to subscribe!While most owners understood the importance of big data, they were not always clear on how to undertake analysis to address business problems. Frequently, these choices need to be based on insights concealed in the data, which is when data mining comes into play.
Data mining is an effective approach for extracting valuable insights from even the largest, most complicated data sets. Whether a business is looking for correlations between consumer habits, marketing campaigns, and weather, or a stock market analyst looking for patterns, data mining can help you discover useful information.
With so much knowledge available, it’s not surprising that more and more individuals are flocking to modern technology; nevertheless, where do you begin? In this article, we will provide an overview of data mining, including its definition, methods, and industry applications.
Also Read: How to Open a Convenience Store
Types of Data Mining
Data mining is typically classified into two types: predictive and descriptive. Each type provides different information and meets specific company demands.
1. Predictive Modeling
Predictive data mining is the process of forecasting future events by studying historical and present data. It is especially helpful in situations when knowing trends, patterns, and likely outcomes is essential.
Predictive data mining can be further divided into several important methods:
- Classification
- Regression
- Analysis of time series
1. Classification is the process of grouping data into predetermined groups. To identify the class to which each data item belongs, it looks at data attributes. After you’ve identified the key qualities of data, you can categorize or classify it systematically.
For example, a restaurant might classify customers based on the frequency of purchases and spending patterns. Restaurants can improve customer satisfaction and loyalty by providing tailored deals and loyalty programs based on this data and classification.
2. Regression is a technique for identifying and analyzing relationships between variables in data. The primary goal of regression is to develop a model that can predict the value of one variable (the dependent variable) based on the changes in other variables (independent variables).
For instance, a hotel chain may employ regression analysis to anticipate revenue for certain periods of the year by examining historical booking data and pricing tactics.
3. Time-series analysis is a specialized technique for evaluating and interpreting data that is acquired at regular periods. This approach is especially helpful for spotting cyclical habits, trends, and seasonal patterns.
Time-series analysis concentrates on data that evolves over time, in contrast to other data mining techniques that work with static information.
It can identify frequent premium clients with a higher average value, as well as those who prefer to spend money on value-added things.
Time-series analysis is widely used by restaurants to predict the demand for patrons at various periods.
Customers can analyze past data of consumer visits during particular times, their buying patterns, and their responses to marketing, one can determine peak hours, seasonal fluctuations, and long-term demand patterns.
Also Read: How Predictive Intelligence transform Retail
2. Descriptive Data Mining
Descriptive data mining aims to summarize and comprehend the properties of historical data. It looks for patterns, connections, and structures in the data that are already there to comprehend the underlying behavior of the data.
Among the techniques employed in descriptive data mining are the following:
- Clustering
- Summarization
- Association rules
1. Clustering– creates groups of members with similar characteristics by grouping different data points according to their commonalities. Unlike classification, which sorts data into predetermined groups based on known criteria, clustering is exploratory, detecting underlying groupings in the data without assigning labels.
For example, a salon business can employ clustering to segment consumers for more effective marketing. Salons can identify natural consumer groups by analyzing data such as visits, spending, services, and demographics.
One cluster may include families who like premium services and products, while another may include retired couples looking for luxury experiences.
2. Summarization– is the process of condensing big datasets into a format that is easier to handle and comprehend while preserving the most important information.
This process entails extracting and presenting key data features to provide a brief summary and understanding of the data’s main characteristics.
Consider a large hotel chain with many locations around the world. Summarization can be used to collect and show essential operational data such as occupancy rates, average room rates, and guest demographics across all properties.
This could include designing a brief report or dashboard that displays key performance metrics at a glance.
3. Association rules– are a descriptive data modeling technique that seeks to identify interesting links and associations between variables in huge datasets.
Association rules, as opposed to summarization, which condenses data, or clustering and classification, which group comparable things, and discover patterns, relationships, and co-occurrences between different objects within the dataset.
This technique is very useful for identifying patterns that may not be immediately evident.
In the context of a hotel, association rules might assist reveal linkages between the services used by guests.
For example, an investigation may suggest that single tourists prefer—and are prepared to pay a premium for—rooms that do not view the pool area.
This pattern would suggest that these visitors, who may be traveling for work, look for more peaceful rooms away from the possible chaos of poolside activities.
Similarly, families with children commonly request adjoining rooms and prefer to dine at the hotel’s family-friendly restaurant.
Also Read: How Data Analytics Process Automation Help Businesses
The 9 Step Process of Data Mining and Its Role in Retail Optimization
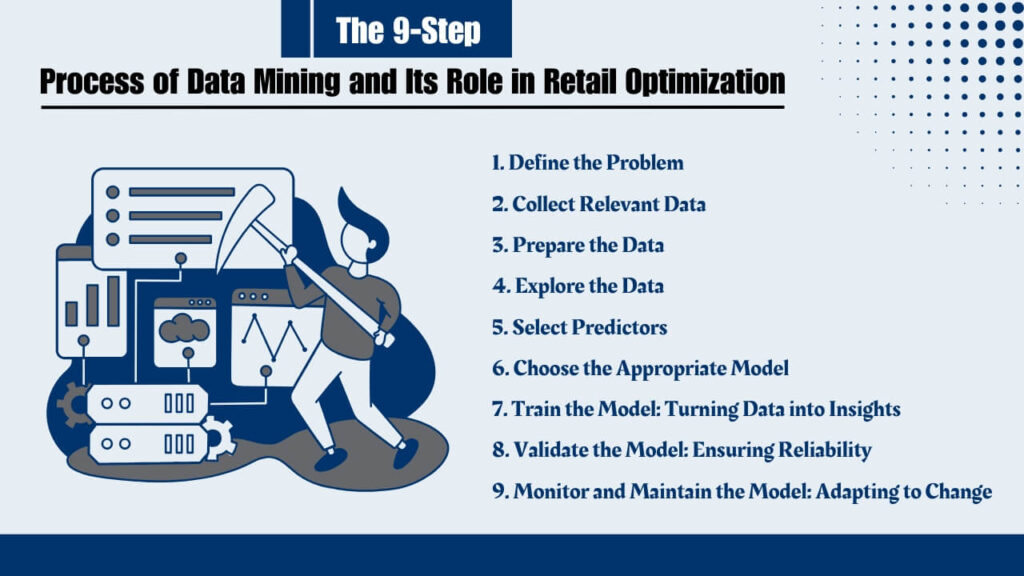
1. Define the Problem
The very first step in setting the foundation for successful data mining is defining the underlying business problem. Every data mining project begins with a well-defined problem. Without clear objectives, even the most advanced analysis can fall flat.
The key is to pinpoint what the business wants to achieve and identify how data can contribute to solving the issue. This step creates a focused roadmap for all subsequent efforts.
For instance, a retail business might notice declining customer loyalty despite offering competitive prices. The question becomes: why are customers not returning?
The objective could be to uncover patterns in customer behavior and to improve retention rates by 15% over the next quarter. By framing this challenge clearly, the business lays the groundwork for actionable insights.
Also Read: How AI Revolutionizes Customer Experience in the Restaurant Industry
2. Collect Relevant Data
Once you know the target, the next step in the data mining process is collecting all the relevant data needed to solve that particular problem.
The primary goal of this step is to ensure that the dataset captures every angle of the issue so that business owners can see the bigger picture.
Data can come from transactional records, POS systems, CRM platforms, accounting platforms, social media, website analytics, customer surveys, or even external sources like market trends. Accuracy and completeness are critical here.
As per our retail example, in order to solve the problem of customer loyalty, businesses can check out the data such as purchase histories, browsing patterns, and even feedback from post-purchase surveys(whether they want to shop again or not), how many percentages of customers are returning and how many are not.
FYI: Advanced analytics tools or maybe now the best AI tools often simplify this step by integrating multiple data streams.
Also Read: Choose the Right AI Data Platform for Your Business
3. Prepare the Data
Just so you know – you can analyze the raw data. It needs to be prepared. Because, the raw data often contains inconsistencies, missing values, or irrelevant information that can lead to misleading conclusions.
Data preparation involves cleaning, standardizing, and formatting the information so it’s easy to understand and prepare for the next steps.
Imagine the retailer finds duplicate records of certain customers or incomplete entries for transaction details. Addressing these issues ensures that the analysis reflects reality and produces reliable results. This stage may be time-intensive but is essential for ensuring the integrity of the insights.
Also Read: Two Way Data Analytics in Shaping Retail Businesses
4. Explore the Data
Before diving deep into data modeling, the next step is exploring the data as it provides a snapshot of what’s going on and sparks ideas for further investigation.
This step generally includes visualization techniques and statistical summaries to uncover trends, correlations, or outliers that hint at deeper patterns. To put it simply, it shows you why it’s happening and what is happening.
As a retailer, you will come to know why the customers are not returning. Is it something with your products, it is the overall experience, or maybe it just appeals to them for the first time?
Visualization tools like heatmaps or bar charts can make these patterns pop, giving you insights you didn’t even know existed – so you know the core reasons behind the problem.
5. Select Predictors
Not every piece of data is a game-changer, so this step focuses on identifying the stars of the show.
Feature selection is about pinpointing the variables that have the most impact on your problem while leaving irrelevant ones on the cutting room floor. This focused approach sharpens the analysis and improves efficiency.
For example, the retailer might determine that customer experience at the store is the problem why the customers are not returning right from entering the store to navigating the store to communicating with the staff and payment are the strongest predictors of customer retention.
By narrowing down these key factors, the business can focus its efforts on what truly impacts loyalty and find out better ways to solve it.
Also Read: Improved Decision Through Decision Intelligence
6. Choose the Appropriate Model
Different problems require different analytical approaches. You need to choose from—whether it’s regression, clustering, decision trees, or neural networks—depending on the data’s characteristics and the desired outcomes.
Some models excel at predicting trends, while others are great for categorizing behavior. The key is to match the model to your problem and data.
In this case, the retailer might opt for a predictive model to determine the likelihood of customers returning based on their previous interactions, purchase habits, and survey feedback.
If the model predicts that customers with poor checkout experiences are less likely to return, the business can target this area for improvement.
7. Train the Model: Turning Data into Insights
Once the model is built, the businesses need to train the model using historical data before validating and final deployment. Training the model is a critical step where the algorithm learns to recognize patterns and relationships within the data.
The goal here is to fine-tune the model so it can accurately predict or classify new data, aligning it with the business objective. And, this step often involves multiple iterations to improve performance.
For instance, in the retailer’s case, the model could be trained using data on customer demographics, purchase histories, and feedback.
By feeding the model a dataset of past customer behaviors and retention outcomes, it learns to identify key indicators of loyalty.
For example, the model might recognize that customers who frequently purchase seasonal items are more likely to return, which can inform future marketing strategies.
Also Read: How Data Analytics Improve the Measurement of Employee Performance
8. Validate the Model: Ensuring Reliability
After training, the model needs to be tested to ensure it performs well on new, unseen data. A robust validation process provides confidence that the model’s predictions or classifications are reliable in real-world applications. If the model is not accurate and reliable, it’s time to tweak, refine, and optimize.
In our example, the retailer could validate the model by comparing its predictions with actual customer behavior over the past month. If the model isn’t performing as expected, tweaks such as adding new predictors or fine-tuning parameters may be necessary.
Once validated, the model is ready for deployment. This step involves integrating it into business operations so it can generate real-time predictions or automate decisions. Deployment bridges the gap between analysis and practical application.
In the retail example, the business might use the deployed model to identify customers who are less likely to return, marking them as “at-risk.” Once flagged, the business can take proactive steps to re-engage these customers by sending them personalized offers, discounts, or surveys to understand their concerns.
This approach ensures that the insights generated by the model are turned into actionable steps, helping the business address the root problem of customer retention in a meaningful way.
9. Monitor and Maintain the Model: Adapting to Change
The business world doesn’t stand still, and neither should your data mining efforts. Customer behavior evolves, and so do the market and business goals, so monitoring the model is a must. It ensures that continues to perform well, even as conditions change. Regular updates keep it relevant and effective.
In the retail context, periodic reviews might reveal that new trends—like an increased focus on sustainability or maybe some quirky signs throughout the store —are influencing customer loyalty. By incorporating these factors into the model, the business can stay ahead of the curve and maintain strong customer relationships.
Data Mining AI Platforms will Do the Job For You!
These days, data mining doesn’t have to mean hiring a team of highly skilled data analysts or scientists. With the rapid advancements in AI and machine learning, the process has become smarter, faster, and far more accessible. In fact, you don’t even need a technical background to benefit—today’s platforms are designed to be intuitive and user-friendly.
If you’re searching for a solution to simplify your data mining journey, let me introduce you to Livelytics. It’s a best-in-class AI-powered platform that seamlessly combines AI, machine learning, big data, and business intelligence capabilities. You can integrate it with your current business tools and get the most out of data for your business.
It is easy to use, accessible, feature-rich, customized, and cost-efficient as well. What makes Livelytics stand out is its versatility—it’s designed to support a wide range of businesses such as restaurants, retail, salons, insurance, finance, and even custom software that adapts to your business needs.
And here’s the best part—you don’t need to spend a fortune to get this AI platform. Livelytics is not only feature-rich but also cost-efficient, starting at just $299/ a month.
If you’re curious about how Livelytics can transform your business and want to see it in action, why wait? Book a free demo today and discover how easy it is to take control of your data and drive meaningful results.
To Conclude
Here’s the wrap on what is data mining and the 10-step process of data mining to get the best out of your business data in your favor.
When done right, it’s an incredibly helpful process that more and more businesses are leveraging it.
And, data mining involves more than just data extraction; it involves discovering the valuable information that propels success in the contemporary corporate environment.
In the current business environment, data mining is essential. It converts raw data into structured, usable information while also revealing hidden patterns and insights that are critical for problem-solving and taking businesses to new heights of success.
If you are looking to get the most out of data mining for your business and make data mining easier for your business, then Livelytics has got you covered. Book a free demo to know more.